How to Measure Marketing Performance: A Guide for Leaders Focused on ROI
Discover how to measure marketing performance with actionable insights and metrics that drive real growth.

If you want to measure marketing performance effectively, you have to look past surface-level numbers. It’s not about impressions; it’s about tying every dollar you spend back to business results like Customer Acquisition Cost (CAC) and Return on Investment (ROI). The only way to achieve this is with a disciplined framework that aligns KPIs with your business model, ensures data integrity, and enables you to adapt your strategy in real-time.
Stop Wasting Money on Campaigns That Don’t Work
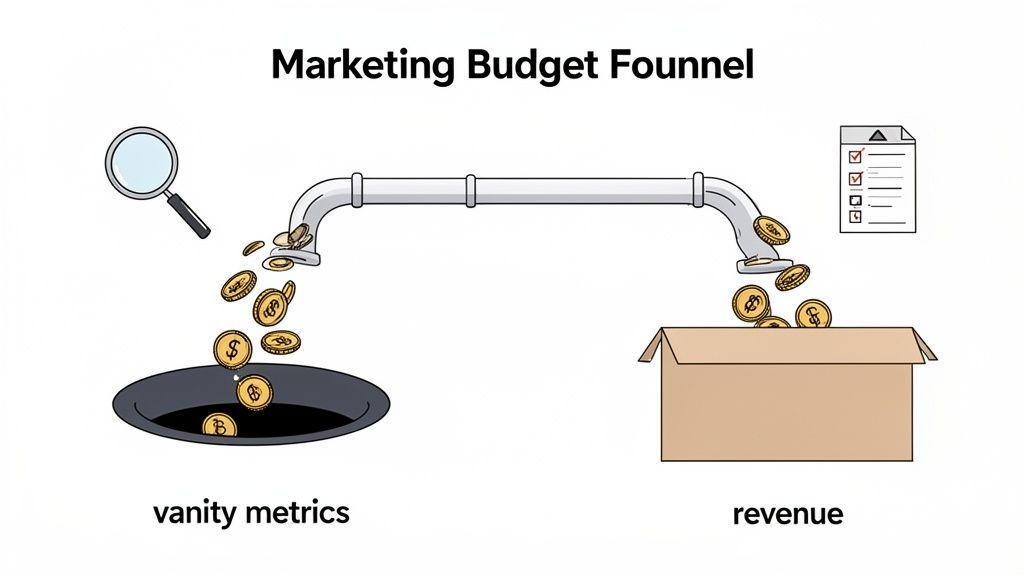
How much of your marketing budget disappears into a black hole of campaigns with no clear return? You see clicks climb, but when you look at the bottom line, nothing has changed. If that sounds painfully familiar, you're not alone.
This is the classic trap for business owners and marketing leaders. We get hooked on "vanity metrics" that create a false sense of progress while our budget quietly drains away on activities that aren't driving revenue.
The Real Cost of Misleading Metrics
The problem is bigger than most people realize. The 2026 State of Performance Marketing Report found that, on average, a staggering 25% of marketing budgets are wasted on ineffective efforts. That number balloons to 30% for companies bogged down by misleading metrics.
Even more telling, the same report found that 66% of leaders admitted their campaigns often look great on paper but completely flop when it comes to driving revenue. This highlights a massive disconnect between marketing activity and business results. You can dig into the specifics in the full performance marketing benchmark report.
This guide gives you a clear, step-by-step framework to fix that. We’ll show you how to measure what actually matters—revenue, qualified leads, and profitable customer acquisition—and shift from reporting on the past to proactively building a growth strategy.
The problem isn't a lack of data. It’s the gap between that data and what it means for your business. Great performance measurement builds a bridge, turning numbers into a clear story about revenue and growth.
For instance, social media is a notorious black hole for budget if not measured correctly. To stop wasting money, learning how to measure Social Media ROI is non-negotiable.
A Framework for Clear Results
We're going to introduce a structured approach, modeled after the 90-day sprints we execute at Ezca for our clients. The goal is to bring clarity to your spending and help you adapt quickly for maximum impact. This system moves you beyond tracking numbers and into making strategic decisions that drive real growth.
Here's an overview of the framework we'll unpack, designed to connect your marketing efforts directly to business results.
Your Framework for Effective Performance Measurement
Following this process ensures every marketing dollar is accountable and every campaign is optimized for profit.
It doesn’t matter if you run your marketing team in-house or work with a partner; these principles are fundamental. If you're still weighing those options, our guide on in-house vs. agency marketing can offer some helpful perspective.
By the end of this guide, you’ll have everything you need to measure your marketing performance correctly and start turning your marketing function into a predictable revenue engine.
Choosing KPIs That Actually Drive Growth
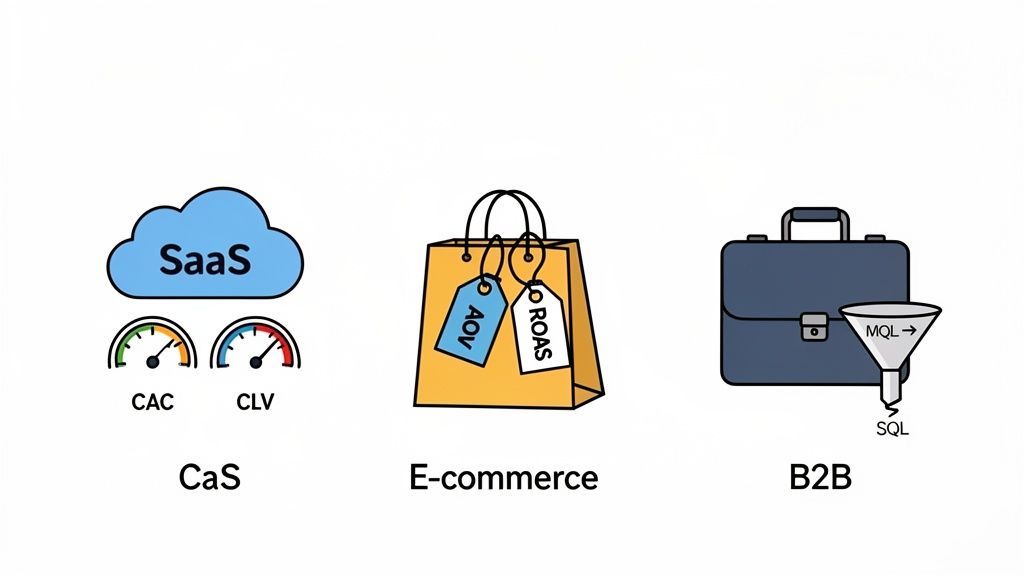
I’ve seen it a hundred times: marketing teams diligently tracking dozens of metrics that have absolutely no impact on the bottom line. The truth is, the KPIs that matter for a SaaS startup are completely different from those an e-commerce brand or B2B company should live and die by.
If you’re not tracking the right things, you’re just guessing. In fact, research shows that only 23% of marketers feel confident they’re even tracking the right KPIs. This leads to chasing vanity metrics, optimizing for the wrong outcomes, and burning through budget on channels that feel busy but don't actually grow the business.
Before you can pick the right indicators, you need to be crystal clear on the difference between a metric and a KPI. It's a subtle but crucial distinction. For more on this, check out this excellent breakdown on understanding KPI vs. metrics.
Think of it this way: a metric is just a number you can measure, like website traffic. A Key Performance Indicator (KPI), on the other hand, is a specific metric you’ve hand-picked because it directly measures your progress toward a critical business goal—like turning that website traffic into paying customers.
What Should a SaaS Business Measure?
For any SaaS company, the game is all about balancing the cost of acquiring a new customer with their lifetime value. Your KPIs must tell you if you're winning that game.
Here’s what to focus on:
- Customer Acquisition Cost (CAC): The total marketing and sales expense required to acquire one new customer. Include everything: ad spend, salaries, and tool costs.
- Customer Lifetime Value (CLV): The total revenue you can realistically expect from a customer over their entire relationship with your business.
- CLV to CAC Ratio: This is the ultimate SaaS health metric. A ratio of 3:1 or higher signals a profitable, scalable acquisition engine. Anything less, and you're likely paying too much for growth.
- Monthly Recurring Revenue (MRR) Growth: Tracks net revenue growth from new signups, upgrades, and expansions, minus revenue lost to churn.
These are the core metrics we use at Ezca to guide our client sprints. They help us answer the most important questions: Are we paying a sustainable price for new users? And are those users sticking around long enough to be profitable?
The KPIs That Matter for E-commerce
With e-commerce, it’s all about profitable transactions and repeat business. High sales numbers are exciting, but the real story is in your unit economics.
In e-commerce, it's easy to mistake high sales volume for success. But if your Return on Ad Spend is below your profit margin or your Average Order Value is stagnant, you might be losing money on every "successful" campaign.
To know if you're really making money, you need to be tracking:
- Return on Ad Spend (ROAS): For every dollar you put into ads, how much revenue do you get back? This is your frontline indicator of campaign profitability.
- Average Order Value (AOV): How much does a typical customer spend in one transaction? Increasing AOV is often a faster path to profitability than just acquiring more customers.
- Cart Abandonment Rate: What percentage of users add items to their cart but don’t complete the purchase? A high rate here is a red flag, often pointing to friction in your checkout flow or unexpected shipping costs.
- Customer Retention Rate: What percentage of your customers come back to buy again? Repeat customers are the lifeblood of a profitable e-commerce store.
Tracking these KPIs shifts your focus from simply counting sales to understanding the quality and long-term value of every customer you acquire.
Measuring What Counts in B2B
B2B is different. Sales cycles are long, decisions involve multiple stakeholders, and the marketing-to-sales handoff is everything. Generating a ton of leads is useless if the sales team can't close them.
We saw this play out with a B2B client celebrating a record number of Marketing Qualified Leads (MQLs). The problem? Sales were flat. The sales team was drowning in low-quality leads and couldn't find the real opportunities.
We shifted their focus from MQL volume to Sales Qualified Lead (SQL)quality and pipeline velocity. It turned out their best deals came from a specific niche they were under-targeting. By redirecting ad spend, they saw a 35% increase in their lead-to-close ratio in just two quarters.
This proved how critical it is to align marketing KPIs with sales outcomes. For B2B, that means focusing on:
- MQL to SQL Conversion Rate: The ultimate measure of lead quality. It shows what percentage of MQLs the sales team accepts as legitimate opportunities.
- Pipeline Velocity: How fast are leads moving through your funnel from first touch to a signed contract? A slow pipeline can kill your revenue projections.
- Cost Per Opportunity: Forget Cost Per Lead. This metric tells you how much marketing spend it takes to create a legitimate sales opportunity, providing a far more accurate picture of marketing ROI.
Choosing the right KPIs is the foundation of a marketing engine that doesn't just report on activity but actively drives predictable, sustainable revenue for the business.
Building Your Data and Attribution Foundation
You can’t measure what you can’t see. Every KPI you track is only as good as the data flowing into it. Without a rock-solid foundation for tracking and attribution, you're making educated guesses about your marketing performance.
For anyone in charge of a marketing budget, getting this right isn't just a "nice to have"—it's how you prove what’s driving growth and justify your spend.
Think of your data as the plumbing of your marketing operation. If the pipes are leaky, you can’t trust the output. The first step is ensuring your core systems—your analytics platform, your CRM, and other data tools—are perfectly in sync. This goes beyond just installing Google Analytics 4. You must connect that front-end activity to the back-end results in your CRM, where a lead becomes a customer and revenue is booked.
Choosing the Right Attribution Model
This is where attribution modeling enters the picture. Attribution is how you give credit for a sale to the different marketing touchpoints a customer interacted with. The model you pick will fundamentally change how you value each channel.
Here are the most common models:
- First-Touch: Gives 100% of the credit to the very first interaction. It’s great for identifying which channels are bringing new people into your funnel.
- Last-Touch: Assigns 100% of the credit to the final touchpoint before a conversion. It's simple, but it over-values channels like branded search that capture intent at the last minute.
- Linear: Divides credit equally among all touchpoints. This gives a more balanced perspective but may not highlight the most influential moments.
- Data-Driven: Uses machine learning to analyze every conversion path and assigns credit based on how much each touchpoint actually contributed. It's the gold standard but requires significant data volume.
Which model should you use? It depends on your sales cycle. A D2C brand selling a $50 product might be fine with a last-touch model. A B2B software company with a six-month sales cycle? That's a different story.
Imagine a B2B buyer’s journey. They might first discover your company through a LinkedIn ad, read a few blog posts, attend a webinar a month later, and finally request a demo after clicking a sales email. A last-touch model gives the sales email all the glory, ignoring the crucial marketing work that built initial awareness and trust.
For longer, complex journeys, a linear or data-driven model paints a more honest picture. It prevents you from mistakenly slashing the budget on a top-of-funnel channel that is quietly teeing up your best customers. Getting this right is a fundamental part of a modern marketing strategy, and you can learn more about what is multi-channel marketing in our detailed guide.
From Theory to Actionable Setup
Putting this data foundation in place is the heavy lifting we do for our clients at Ezca, including major brands like Logitech. We use tools like Segment to build a unified customer profile, pulling data from every source into a single data warehouse. This creates the "single source of truth" every marketer dreams of.
With this complete view, we can map out the entire customer journey, from their first ad impression to the final invoice. By tying marketing spend from platforms like Google Ads and Meta directly to revenue data in the CRM, we calculate true ROI, not just surface-level ROAS.
This clarity is what gives us the confidence to shift budgets and make bold decisions during our 90-day sprints. Every dollar is tracked, every move is justified by data, and nothing is left to chance. Without this foundational work, you’re flying blind.
Creating Dashboards That Tell a Clear Story
Raw data is just a mess of numbers. A spreadsheet full of metrics doesn't motivate anyone to action. The magic happens when you turn that data into a story—a story that shows what's working, what's a waste of money, and where to focus next.
That’s what a great dashboard does. It’s not a data dump; it’s a decision-making machine. It becomes the one place everyone on the team can look to for the truth, allowing you to make quick, smart adjustments to your marketing strategy.
Know Your Audience, Tell the Right Story
A common mistake is building a single, massive dashboard for everyone. A dashboard perfect for a paid media manager is useless for a CEO. Each stakeholder needs a different view to do their job well.
The goal is to give each person just the information they need, without the noise. Think of it as creating role-specific views.
- For the CEO or Founder: They need the 30,000-foot view. They aren’t concerned with click-through rates; they want to know if the marketing investment is growing the business. Their dashboard should answer, "Are we making money from this?" Focus on big-picture numbers: overall Marketing ROI, Customer Acquisition Cost (CAC), and total Marketing-Sourced Revenue.
- For the CMO or Marketing Director: This is the bridge between high-level strategy and execution. They need to see how campaigns are translating into business results. Think pipeline velocity, MQL-to-SQL conversion rates, and ROI broken down by channel.
- For the Paid Media Manager: This person lives and breathes campaign data. They need granular, real-time feedback to optimize ads on the fly. Their dashboard should be tactical, featuring metrics like Return on Ad Spend (ROAS), Cost Per Click (CPC), and Click-Through Rate (CTR), drilled down to the ad level.
When you give people the right view, you empower them to make better decisions faster.
Designing a Dashboard That Actually Gets Used
Building an effective dashboard is as much about design as it is about data. You’re telling a visual story, so the layout must guide the viewer’s eye to the most critical information first.
A great dashboard answers more questions than it raises. If your team walks away from a report with more confusion than clarity, the dashboard has failed—no matter how accurate the data is.
When you're building your dashboards in a tool like Looker Studio or Tableau, stick to these core principles:
- Top-Left is Prime Real Estate: Your most important KPIs—like total leads, revenue, or ROI—should be big, bold scorecard numbers right at the top left, where the eye naturally lands first.
- Show Trends, Not Just Snapshots: A single number tells you little. Use line charts to show performance over time. Seeing MRR growth plotted over the last 90 days gives crucial context. Are you on the right track?
- Make Comparisons Obvious: Use bar and column charts to compare channels or campaigns. It becomes instantly clear who the winners and losers are, helping you decide where to double down.
- Less is More: Resist the temptation to cram every metric onto one screen. A clean, uncluttered dashboard is far more powerful. Use white space to break up sections and make the whole thing easy to scan.
This process—transforming complex data into a clear path for growth—is a core part of what we do at Ezca. We don’t just deliver spreadsheets. We build custom, automated dashboards that give our clients real-time clarity, empowering them to make the same agile budget decisions that define our 90-day sprint methodology.
Turning Measurement Into Action With 90-Day Sprints
Data and dashboards are noise if they don't drive better, faster decisions. This is where your measurement framework stops being a report card and starts being a roadmap for growth.
It all begins with a clear-eyed look at your return on investment.
A straightforward, yet powerful, way to get a baseline for marketing ROI is this formula:
((Sales Growth - Marketing Cost) / Marketing Cost) * 100
This gives you a high-level picture of profitability. But true agility isn’t about looking in the rearview mirror; it's about applying this thinking in a structured, repeatable cycle. For that, we rely on the 90-day marketing sprint.
Adopting an Agile Sprint Framework
Forget the static annual marketing plan. The market moves too fast. The 90-day sprint is an agile approach that creates discipline and focus, and it’s a cornerstone of how we operate at Ezca.
This framework breaks your big annual goals down into manageable quarterly objectives. Instead of just reporting on what happened, you're actively steering performance within a contained, high-impact window.
The process boils down to a few key activities:
- Set Quarterly Goals: Define what success looks like over the next 90 days. Be specific and measurable, like "Generate 250 SQLs from organic search" or "Achieve a 4:1 ROAS on paid social."
- Execute and Measure Weekly: As you launch campaigns, conduct weekly check-ins. This is a quick pulse check on your main KPIs to see if you're veering off course.
- Reallocate and Optimize Mid-Sprint: This is where the real work gets done. You can't afford to wait until the quarter is over to make a change.
The most important principle of a 90-day sprint is that your budget is fluid, not fixed. You move resources to what’s working now, not what you thought would work three months ago.
Let's walk through a real-world scenario. Imagine you're three weeks into a sprint. Your LinkedIn campaign is struggling, with a Cost Per MQL that’s 50% higher than your target. Meanwhile, a content marketing initiative is crushing it, already hitting 70% of its quarterly lead goal.
The agile response is immediate. You don’t "wait and see." You pull a portion of that underperforming LinkedIn budget and redirect it to amplify the successful content—perhaps by promoting the post or creating spin-off assets. That single, data-driven pivot can be the difference between hitting and missing your goals. It’s a core part of measuring performance effectively, something we practice when we work on how to increase organic traffic through continuous tuning.
From Raw Data to Actionable Story
Making those quick pivots is only possible if your dashboards tell you a clear story at a glance. You shouldn't have to hunt for the narrative.
This is the simple, three-step journey from a spreadsheet of numbers to a story that drives decisions.
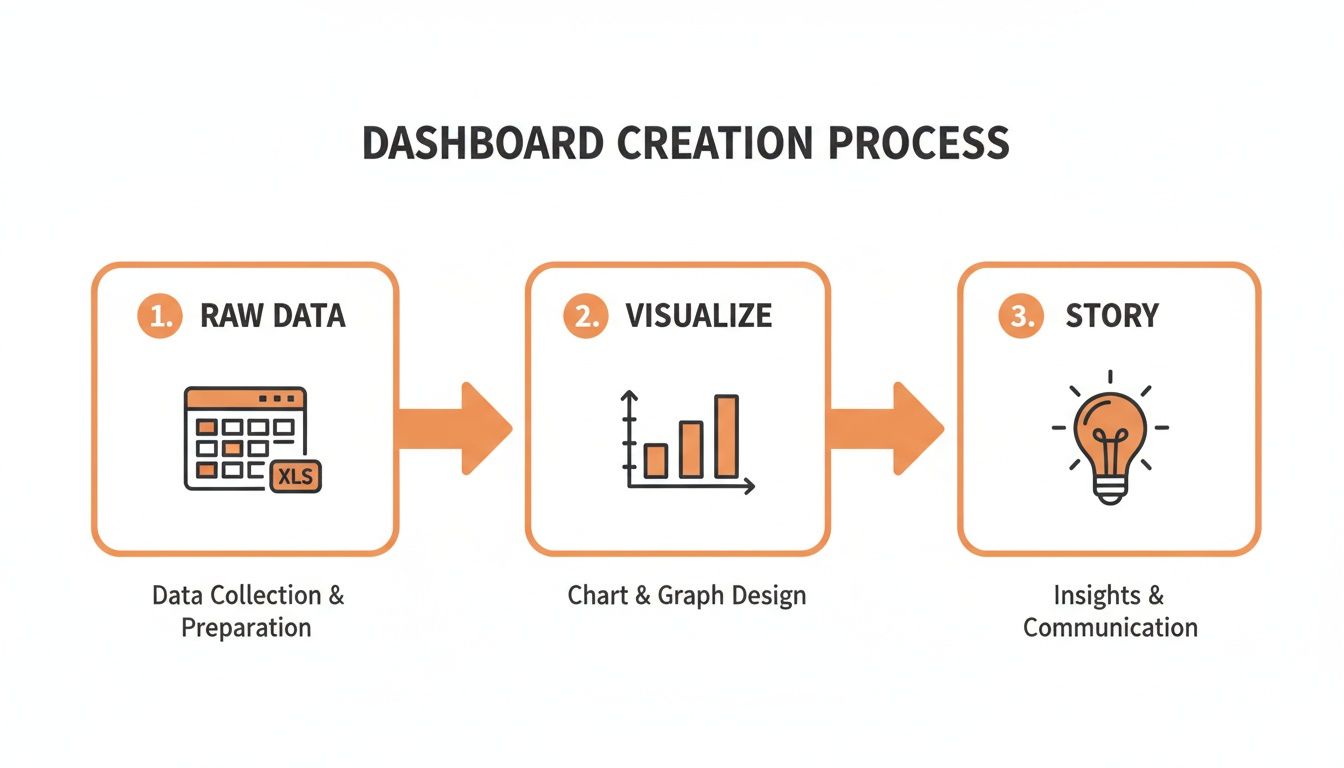
The flow from raw data, to visualization, and finally to a clear story is what gives you the confidence to make the rapid changes a 90-day sprint demands.
By embracing this iterative cycle, marketing shifts from being a passive reporting function to an active growth engine. You create a system where measurement directly fuels action, constantly tuning your strategy for better results. This is how marketing stops being a cost center and becomes a predictable driver of revenue.
A Few Common Questions About Marketing Measurement
When you start getting serious about measuring marketing, a few questions always seem to pop up. We hear them all the time from business owners and marketing leaders. Getting these fundamentals right is the key to building a measurement system that doesn't just create reports, but actually helps you make better decisions.
Let's dive into some of the most common ones.
What Are the Most Common Mistakes in Marketing Measurement?
The biggest trap is chasing vanity metrics. These are numbers that feel good to report—like social media likes, impressions, or a spike in website traffic—but don't tie back to revenue. It’s easy to get busy tracking activity, but the real work is measuring business impact.
Another classic misstep is picking the wrong attribution model. For instance, a D2C brand with an impulse-buy sales cycle can get by with last-touch attribution. But if you’re a B2B company with a six-month sales process, that same model gives you a completely warped view of which channels are truly valuable.
Finally, a critical failure is not connecting your marketing data to sales outcomes in your CRM. If that link is missing, you can’t calculate true ROI or prove how marketing contributes to the bottom line. You just have separate piles of data that tell an incomplete, and often misleading, story.
How Often Should I Review My Marketing Metrics?
There isn't a single "right" answer. It depends on who's looking at the data and what they need to do with it. We're big believers in a tiered reporting schedule that syncs with our 90-day sprint methodology. This gets the right information to the right people at the right time.
At Ezca, we break it down like this:
- Weekly Check-in: For tactical, in-the-trenches data. Channel managers should be looking at ad spend, click-through rates (CTR), and cost per click (CPC) every week to make quick optimizations.
- Monthly Review: This is where you zoom out. The whole marketing team should analyze channel-level ROI, lead quality, and progress toward monthly goals. This is when you might decide to reallocate budget between channels.
- Quarterly Strategy Session: For high-level, strategic planning. Your leadership team should review overall marketing ROI, set the budget for the next 90-day sprint, and ensure alignment with company objectives.
A tiered reporting cadence prevents leaders from getting bogged down in micromanagement and empowers channel managers to be agile. It creates a shared rhythm of performance and accountability across the entire organization.
This cadence turns measurement from a backward-looking report into a proactive process that guides your strategy forward. It builds a constant feedback loop, allowing you to make smart adjustments fast, maximizing growth and cutting wasted spend.
What’s the Difference Between a KPI and a Metric?
People use these terms interchangeably, but the distinction is incredibly important. Nailing this difference is the first step toward focusing on what really moves the needle.
A metric is simply any number you can track. Your website generates thousands of them—page views, time on page, bounce rate. Metrics are just raw data points.
A Key Performance Indicator (KPI), on the other hand, is a specific metric you’ve hand-picked because it directly measures your progress toward a core business goal. A KPI is a metric on a mission.
For example, "website visitors" is a metric. But if your main goal is to generate more sales-qualified leads, then your KPI is the conversion rate of website visitors into qualified leads. You might have thousands of metrics, but you should only ever have a handful of true KPIs.
Think of it like driving a car. Your dashboard shows dozens of metrics—engine RPM, tire pressure, outside temperature. But there are only a few KPIs you watch to get to your destination: your speed, your fuel level, and your engine temperature. Focusing on your KPIs helps you tune out the noise and concentrate on the numbers that will get you where you want to go.
Ready to stop guessing and start driving predictable growth? The performance marketing experts at Ezca build data-driven strategies for SaaS, e-commerce, and B2B companies. We turn measurement into action with our proven 90-day sprint methodology. Schedule a consultation with Ezca today.