Mastering Customer Lifetime Value Calculation for Predictable Growth
Unlock sustainable growth with our guide to customer lifetime value calculation. Learn proven formulas and apply actionable strategies for SaaS and e-commerce.

Calculating Customer Lifetime Value (CLV) is the process of determining the total net profit a business can expect from a single customer over their entire relationship. It's a predictive metric that shifts your focus from short-term sales to long-term profitability.
Why CLV Is Your Most Important Growth Metric
Most businesses are trapped in the cycle of chasing the next sale. The most successful leaders, however, play a longer game. For marketing leaders and business owners, a sharp customer lifetime value calculation is the dividing line between expensive, one-off wins and a predictable revenue engine.
The real strategic power emerges when you pair CLV with its counterpart: Customer Acquisition Cost (CAC). Knowing a customer's lifetime worth tells you exactly how much you can afford to spend to acquire them. This isn't just a metric; it's a roadmap to profitable growth.
Moving Beyond Simple Revenue
Top-line revenue and new customer counts are vanity metrics. They feel good but ignore profitability. A high-volume customer who churns after one low-margin purchase might have cost you money when you factor in acquisition and support costs.
Real value lies in retention. A customer making smaller, consistent purchases over several years is almost always more profitable than a one-hit wonder. This isn't just theory—data shows that a mere 5% increase in customer retention can boost profits by 25% to 95%. Retention is the new acquisition.
CLV forces you to analyze the entire customer journey. It's not just about the first conversion. It’s about the onboarding experience, the quality of support, and the product's evolution. Every touchpoint either builds or erodes long-term value.
Strategic Budgeting and Channel Optimization
A firm grasp on your CLV brings clarity to budgeting. You stop guessing and start making precise, data-backed decisions. By calculating CLV for different customer segments, you can quickly identify your most profitable audiences.
For instance, discovering that customers from organic search have a 25% higher CLV than those from a paid social campaign is a game-changing insight.
With that knowledge, you can immediately:
- Reallocate marketing spend to the channels delivering high-value customers.
- Refine ad creative and messaging to attract more prospects who resemble your ideal, high-CLV profile.
- Set intelligent CAC targets that ensure a healthy CLV:CAC ratio, aiming for at least 3:1 to build a sustainable business.
This data-driven approach is the foundation of Ezca's agile 90-day sprints. We continuously analyze CLV by channel and cohort, allowing us to pivot budgets to what’s actually driving long-term, profitable growth for our partners. For a deeper dive, our article Why Customer Lifetime Value Is Your Secret Weapon is an excellent resource.
The Core Formulas for Nailing Your CLV Calculation
Let's get tactical. Moving from the concept of CLV to a practical calculation can seem daunting, but the math is straightforward. We'll start with a simple historical model and then introduce the nuances that unlock true profitability insights.
This exercise is designed to shift your company's mindset from the frantic scramble for new customers toward a more sustainable model built on long-term value.
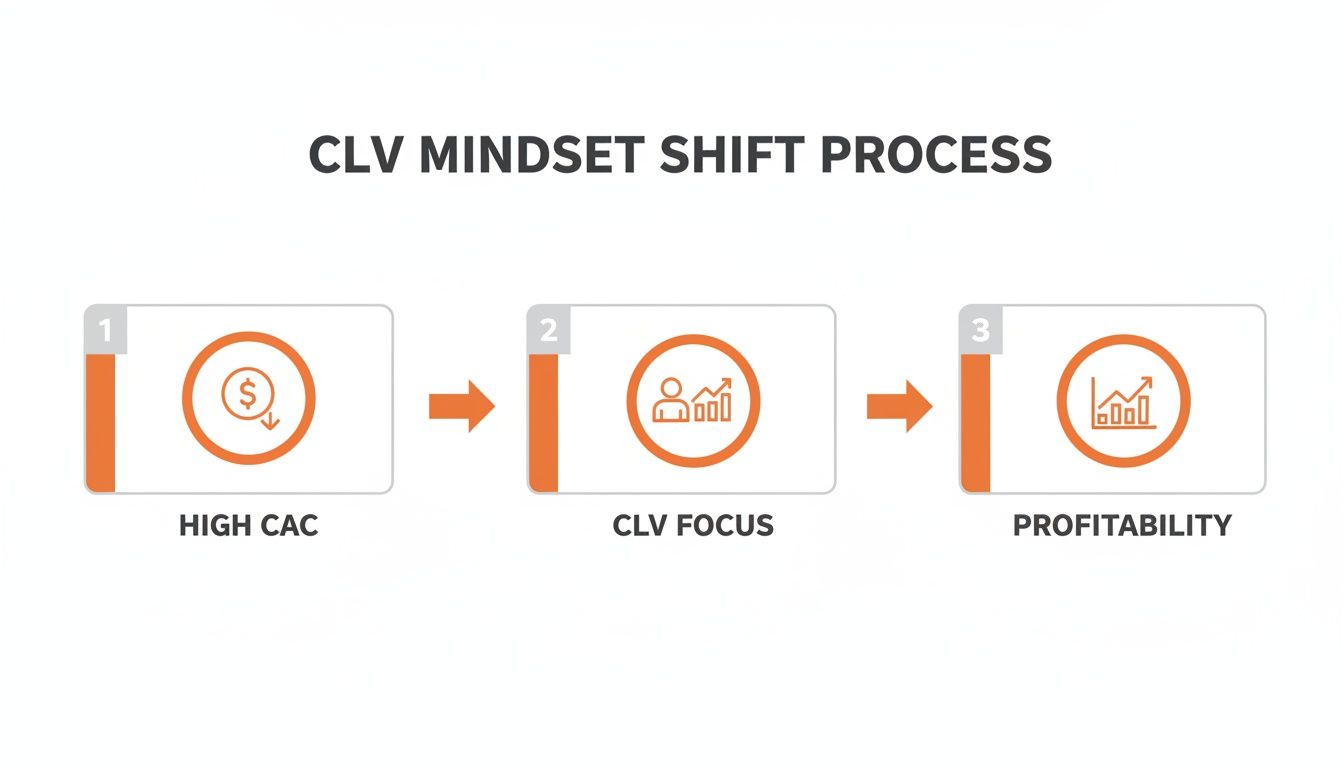
You stop renting customers and start owning the relationships. That's the pivot from merely spending on acquisition to building a genuinely profitable business.
The Foundational Historical CLV Formula
The simplest starting point is to analyze past customer behavior. This historical approach provides a baseline estimate of a customer's worth.
You'll need three key metrics from your data:
- Average Purchase Value (APV): The average transaction size. Divide total revenue by the number of orders over a specific period.
- Purchase Frequency (PF): How often a customer buys. Divide the total number of orders by the number of unique customers.
- Customer Lifespan (CL): How long customers remain active. For established businesses, average the time between a customer's first and last purchase.
The formula is:
CLV = Average Purchase Value × Purchase Frequency × Customer Lifespan
For an e-commerce brand, this simple calculation is often the first step toward building sustainable growth. Imagine an online store where the average order is $65, customers typically buy 4 times a year, and the average customer stays for 5 years. That yields a gross CLV of $1,300. If your CAC is $40, your net CLV is a healthy $1,260. This basic formula gained prominence as analytics platforms made the data easier to track. You can explore how this impacts pricing in this complete 2026 guide on pricing and CLV.
The Margin-Based Formula for True Profitability
The historical model is a great start, but it's based on revenue, not profit. For businesses where margins are critical—like SaaS, subscriptions, and many B2B services—a more precise formula is needed.
This is where the margin-based customer lifetime value calculation proves its worth. It introduces two vital elements:
- Gross Margin (GM): The percentage of revenue that is actual profit after accounting for the cost of goods sold (COGS). For a SaaS company, this includes hosting, essential third-party software, and direct support costs.
- Churn Rate: The percentage of customers who leave each month or year. Its inverse (1 / Churn Rate) offers a quick and effective estimate of the average customer lifespan.
The formula becomes:
CLV = (Average Revenue Per User × Gross Margin) / Churn Rate
Mastering this formula is what separates good marketing leaders from great ones. It connects every marketing dollar directly to bottom-line profit. A high-revenue customer who is expensive to service and likely to churn is a liability, not an asset.
Worked Examples: SaaS vs. E-commerce
Let's see these formulas in action to understand their impact.
E-commerce Example (Historical CLV)
Consider a direct-to-consumer apparel brand.
- Average Purchase Value: $120
- Purchase Frequency: 3 times per year
- Customer Lifespan: 2.5 years
- CLV = $120 × 3 × 2.5 = $900
This $900 figure represents the gross revenue you can expect from an average customer. It immediately informs how much you can spend on acquisition while remaining profitable.
SaaS Example (Margin-Based CLV)
Now, let's look at a B2B SaaS company.
- Average Revenue Per User (ARPU): $200/month
- Gross Margin: 80% (0.8)
- Monthly Churn Rate: 2% (0.02)
- CLV = ($200 × 0.8) / 0.02 = $160 / 0.02 = $8,000
That $8,000 isn't revenue—it's the total profit you can expect from a new customer. This is a powerful number that leaders use to justify marketing budgets, set sales commissions, and decide which channels deserve more investment. Arriving at this figure is a core component of the data-driven sprints we run at Ezca.
A one-size-fits-all CLV formula offers a general overview but lacks the specificity needed for smart decision-making. The real insights come from adapting the calculation to your unique business model.
What drives value for a SaaS company is worlds apart from what matters to an e-commerce store. Using a generic formula is like navigating a city with a world map—you'll miss all the important details. For any leader serious about growth, tailoring your CLV calculation is non-negotiable.
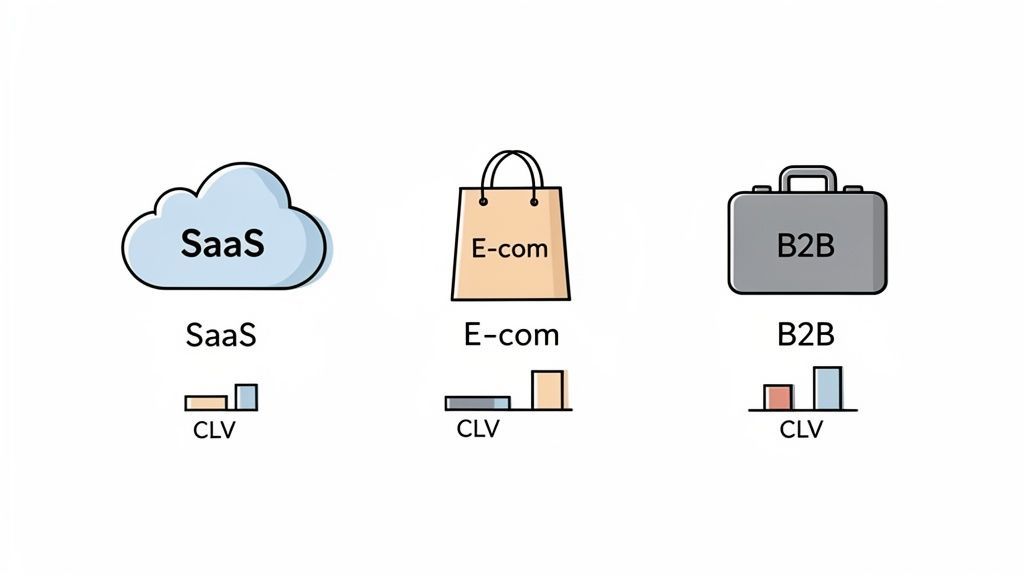
To clarify how these nuances play out, here’s a comparison of key metrics.
CLV Calculation by Business Model
This table highlights how each model prioritizes different variables. Now, let's explore their real-world application.
CLV for SaaS and Subscription Companies
In the subscription economy, success is a long game built on retention and expansion revenue. Your CLV calculation must reflect this reality by focusing on recurring revenue and customer loyalty.
To get an accurate SaaS CLV, you need three key numbers:
- Average Revenue Per Account (ARPA): Your average recurring revenue (monthly or annual) per customer.
- Gross Margin %: Don't use raw revenue. You must subtract COGS—like hosting, third-party software, and direct support costs.
- Customer Churn Rate: The percentage of customers who cancel in a given period. This is your most critical lever for boosting CLV.
Example: A SaaS with Tiered Pricing
Imagine a software company with a $100/month "Pro" plan and a $500/month "Business" plan. Their gross margin is 80%, and they have a 3% monthly churn rate. Calculating CLV for each tier separately provides strategic direction.
- Pro Plan CLV: ($100 ARPA × 0.80 Margin) / 0.03 Churn = $2,667
- Business Plan CLV: ($500 ARPA × 0.80 Margin) / 0.03 Churn = $13,333
The difference is stark. A "Business" customer is worth five times more. This isn't just an interesting fact; it's a strategic directive telling you where to aim your marketing budget to attract high-value accounts.
CLV for E-commerce Brands
E-commerce is a different beast. While subscriptions are growing, the classic model relies on individual transactions. The goal is to encourage repeat purchases.
For e-commerce, focus on these metrics:
- Average Order Value (AOV): The average amount a customer spends per order.
- Purchase Frequency: How many times a customer buys within a set period (e.g., one year).
- Customer Lifespan: How long the average customer keeps buying.
For e-commerce, the most powerful analysis comes from segmenting CLV by acquisition channel. This reveals not just which channels drive traffic, but which ones drive profitable, long-term customers.
Example: A Shopify Store’s Channel Performance
Let's say a Shopify store compares customers acquired via Google Ads with those from organic search.
- Google Ads Customer: AOV: $80
- Purchases per year: 1.5
- Average Lifespan: 1.8 years
- CLV = $80 × 1.5 × 1.8 = $216
Organic Search Customer:
- AOV: $75
- Purchases per year: 2.5
- Average Lifespan: 3 years
- CLV = $75 × 2.5 × 3 = $562.50
Even with a slightly lower AOV, the organic search customer is over 2.5x more valuable because they buy more often and stay longer. This is a clear signal to double down on SEO. To dig deeper into channel strategy, learn more about what is multi-channel marketing and how it fits into a focused acquisition approach.
CLV for B2B Services and Agencies
For B2B service businesses like consulting firms or marketing agencies, CLV revolves around contract value and long-term partnerships. Sales cycles are longer and more resource-intensive, making each client relationship a significant investment.
Your calculation should center on:
- Average Contract Value (ACV): The typical annual value of a client contract.
- Client Retention Rate: The percentage of clients who renew annually. From this, you can derive the average client lifespan (Lifespan = 1 / Churn Rate, where Churn = 1 - Retention Rate).
- Gross Margin %: Your profit after accounting for the direct costs of servicing that client, such as team member salaries.
By running these numbers for different service lines or client profiles, you can quickly spot which offerings attract the most profitable, loyal partners. That insight allows you to sharpen your sales focus and marketing messages.
Putting Your CLV Data into Action
Calculating CLV is a critical first step, but the number itself is just a data point. The real value comes from using that insight to make smarter, more profitable decisions across your entire business.
This is where you translate theory into action. As a leader, your job is to weave CLV into your strategic planning. It should inform everything from marketing budgets to product roadmaps, ensuring every dollar spent and feature built aims to create long-term, sustainable value.
Establish Your Target Customer Acquisition Cost
One of the most immediate uses for CLV is to answer the question: "How much should we spend to acquire a new customer?" This lets you set a concrete target for your Customer Acquisition Cost (CAC), moving from guesswork to a data-backed strategy.
A healthy, sustainable business model typically aims for a 3:1 CLV:CAC ratio. For every dollar you invest in acquisition, you should expect at least three dollars in lifetime profit. A lower ratio means you're likely paying too much and burning cash. A much higher ratio suggests you may be underinvesting and leaving growth on the table.
A 3:1 CLV:CAC ratio isn't just a best practice; it's a fundamental indicator of a sustainable business. It represents the balance between aggressive growth and long-term profitability—a core principle we apply at Ezca to ensure our partners scale responsibly.
Reallocate Spend to High-Value Channels
You'll quickly discover that not all acquisition channels are created equal. Segmenting CLV by source will reveal which channels deliver your most valuable customers.
For example, paid social ads might generate high lead volume, but customers from organic search could have a 50% higher CLV. This insight is a clear directive to reallocate your budget. It doesn't mean abandoning lower-CLV channels, but you should double down on what works best. If high-value customers are finding you through search, it’s a strong signal to invest more in SEO. To learn more, check out our guide on how to increase organic traffic.
Use Cohort Analysis to Guide Retention and Product Development
This is where CLV becomes a powerful strategic tool. By grouping customers into cohorts—typically by the month or quarter they signed up—you can track their value over time. This shows you how changes to your product, pricing, or marketing affect long-term customer value.
For B2B lead generation pros and SaaS marketing leaders, the bottom-line CLV formula—factoring in gross margins and CAC—reveals true profitability. Imagine: APV of $5,000, Purchase Frequency of 2/year, Lifespan of 4 years, 50% gross margin, and $300 CAC. Top-line CLV is $40,000, but the bottom-line net profit is ($40,000 × 0.50) - $300 = $19,700 per customer. Research shows brands using CLV segmentation can see 15-20% revenue growth in just six months, which is why it's a critical defense against rising acquisition costs. You can find more practical examples of CLV in action from platforms like monday.com.
Did you notice the cohort from Q3 has an unusually high CLV? That’s your cue to investigate.
- Did you roll out a new feature they adopted heavily?
- Was there a change in your onboarding sequence that month?
- Did a specific marketing campaign attract this high-value group?
The answers are a goldmine. They create a direct feedback loop to inform your product roadmap and retention strategies, ensuring you’re building a business your best customers will love for years to come.
Avoiding Common Pitfalls in CLV Analysis
You've calculated your customer lifetime value—a huge win. But many teams stumble here, falling into common traps that render their new metric misleading.
A flawed customer lifetime value calculation doesn't just produce bad data; it leads to bad decisions, including misallocated budgets, missed growth opportunities, and a skewed understanding of your business. Getting this right is about turning CLV into a reliable engine for growth.
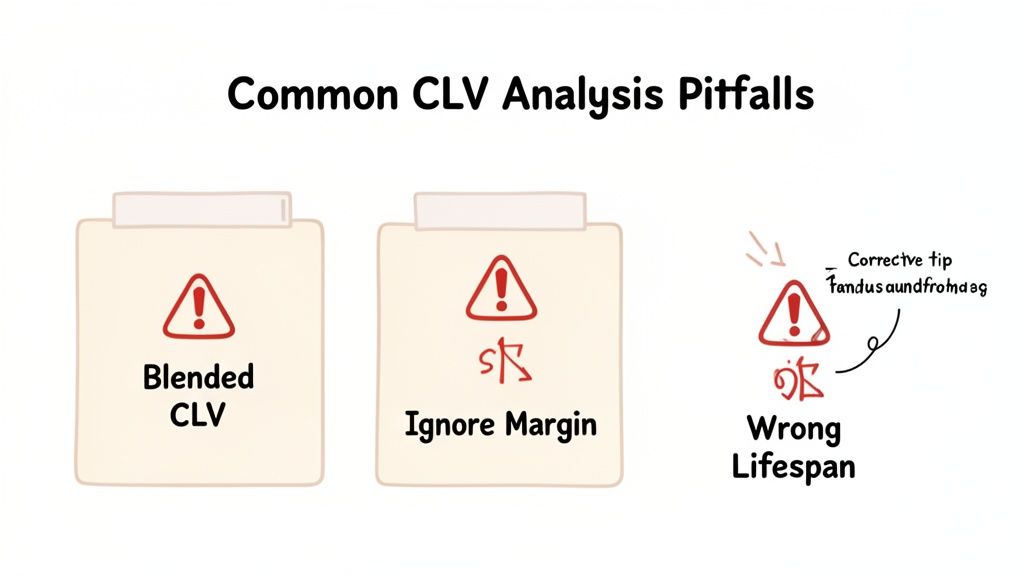
The good news? These mistakes are entirely avoidable. Let’s walk through the three most common CLV errors and how to steer clear of them.
Mistake 1: Relying on a Single, Blended CLV
Calculating one average CLV for your entire customer base is a common error. This blended number treats your most loyal, high-spending advocates and your one-and-done discount shoppers as identical. They are not.
A single, blended CLV hides your biggest opportunities. The fix is segmentation. You must calculate CLV for distinct customer groups. Start by breaking them down by:
- Acquisition Channel: Are customers from paid search more valuable than those from organic social?
- First Product Purchased: Do customers who buy your entry-level product upgrade, or do they churn faster?
- Demographics or Firmographics: For B2B, do clients in the tech industry have a higher CLV than those in manufacturing?
I once worked with an e-commerce brand whose blended CLV was a respectable $350. But when we segmented by acquisition source, we found the CLV for customers acquired through their blog was over $900. That single insight completely changed their strategy, prompting a major budget shift toward content marketing that drove incredible profit growth.
Mistake 2: Ignoring Gross Margin
Focusing on revenue alone is a vanity metric. A customer who brings in $10,000 in revenue but costs $9,000 to support is far less valuable than one who generates $3,000 with only $500 in associated costs.
If you're not factoring in your gross margin, you're getting a dangerously incomplete picture of profitability.
Always use a margin-based CLV. For SaaS and B2B, this is non-negotiable. Subtract all direct costs of serving a customer—such as hosting fees, support team salaries, and third-party software licenses—from their revenue. This gives you the real profit value, not just a top-line number. Figuring out the resources for this kind of detailed analysis can be a challenge. Our guide on in-house vs agency marketing can help you weigh the pros and cons.
Mistake 3: Miscalculating Customer Lifespan
An inaccurate customer lifespan will throw off your entire CLV calculation. New companies often make overly optimistic guesses, while established businesses might use a simple average that doesn't account for how churn has evolved.
The most reliable method is to calculate lifespan directly from your churn rate using the formula Lifespan = 1 / Churn Rate.
For even greater accuracy, use cohort analysis. Track groups of customers who signed up in the same month or quarter to see how long they actually stick around. This reveals how retention changes over time and helps you build a more realistic CLV model. Industry benchmarks can also serve as a helpful reality check. Data shows average CLVs around $70 for e-commerce and $702 for SaaS, but top-tier companies often achieve 5x those figures through smart retention. Knowing a 5% increase in retention can boost profits by 25-95%, it's clear why getting lifespan right is so critical.
Common Questions About CLV Calculation
Once you move past the theory of Customer Lifetime Value, practical questions arise. A solid customer lifetime value calculation is one thing, but making it work day-to-day is another. Let's tackle the most common questions from business leaders putting CLV into practice.
These aren't hypotheticals; they are practical roadblocks that can halt a data-driven strategy. Getting these answers straight will give you the confidence to make CLV a core part of your business operations.
How Can I Estimate Customer Lifespan for a New Business?
This is a classic startup dilemma. With limited data, you can't simply average the time between a customer's first and last purchase. You have to get creative with early indicators.
One reliable method is to use your churn rate, even with only a few months of data. If you consistently see 4% of your customers leave each month, you can infer an average customer lifespan of 25 months (1 / 0.04). This is a dynamic estimate you can update as more data becomes available.
Another good starting point is to look at industry benchmarks. While not perfect, knowing the average customer for a similar SaaS product stays for three years gives you a reasonable number to start with. Just be transparent about the assumption and commit to refining it with your own historical data.
What Is a Realistic CLV to CAC Ratio?
The 3:1 ratio is often cited as the gold standard—for every dollar spent on acquisition, you should make three back. In reality, the "right" ratio depends entirely on your industry, funding, and growth stage.
- Early-Stage, High-Growth Startups: These companies often operate at a 1:1 ratio or even lower for a period. They are deliberately burning cash to capture market share, usually with VC backing, planning to optimize for profit later.
- Established Subscription Businesses (SaaS/E-commerce): This is where the 3:1 to 5:1 range is the healthy sweet spot, signaling a self-funding, sustainable growth engine.
- Mature, Market-Leading Companies: It’s not unusual for market leaders to hit ratios of 10:1 or higher. They benefit from strong brand recognition and word-of-mouth, which dramatically lowers their acquisition costs.
Your target CLV:CAC ratio should be a strategic choice, not a static number. It reflects your business goals—are you prioritizing aggressive market capture or steady, profitable growth? Adjusting this target is a key lever in your financial strategy.
How Often Should My Team Recalculate CLV?
Calculating CLV once and forgetting about it is a recipe for bad decisions. Your CLV is a living metric that changes with your marketing, product updates, and customer behavior. The right frequency depends on how fast your business moves.
For most e-commerce and SaaS companies, a quarterly CLV recalculation is a great rhythm. It’s frequent enough to measure the impact of new campaigns or pricing updates. In a fast-moving market, you might even shift to a monthly calculation for a tighter feedback loop.
The key is to sync your CLV review with your strategic planning. At Ezca, we run 90-day sprints. A quarterly CLV check-in fits perfectly, allowing us to see what worked as we plan the next cycle.
What Are the Best Tools for Automating CLV Tracking?
Calculating CLV in a spreadsheet is a great way to learn, but it doesn't scale. As you grow, you'll need tools to automate the process and provide real-time insights. For a quick terminology refresher, this glossary entry on Customer Lifetime Value (CLTV) is a handy resource.
Here are the types of tools successful businesses rely on:
- Customer Relationship Management (CRM) Systems: Platforms like Salesforce or HubSpot are your foundation. They store the raw data—purchase history, customer interactions, support tickets—needed for the calculation.
- Business Intelligence (BI) Tools: This is where the magic happens. Software like Tableau or Looker connects to your CRM and other data sources to build automated CLV dashboards for segmentation, visualization, and tracking.
- Customer Data Platforms (CDPs): Tools like Segment create a single, unified profile for every customer. They excel at tracking user behavior across your website, app, and email, then feeding that clean data into other systems for pinpoint-accurate analysis.
Ready to stop guessing and start building a predictable revenue engine? At Ezca Agency, we use data-driven 90-day sprints to help our partners master their CLV and unlock profitable growth. We'll help you find your most valuable customers and build a strategy to get more of them.