How to Improve Website Conversion Rate with a Data-Driven System
Learn how to improve website conversion rate with this guide. Discover expert CRO strategies, from user behavior analysis to A/B testing, for real results.

Improving your website's conversion rate isn't about guesswork or random tweaks. For marketing leaders and business owners, it's about a methodical process of analyzing user behavior, forming data-backed hypotheses, and running iterative A/B tests. This is how you move from hoping for growth to building a predictable engine that fixes real friction points in your customer's journey and drives bottom-line results.
A Framework for Doubling Your Website Conversions
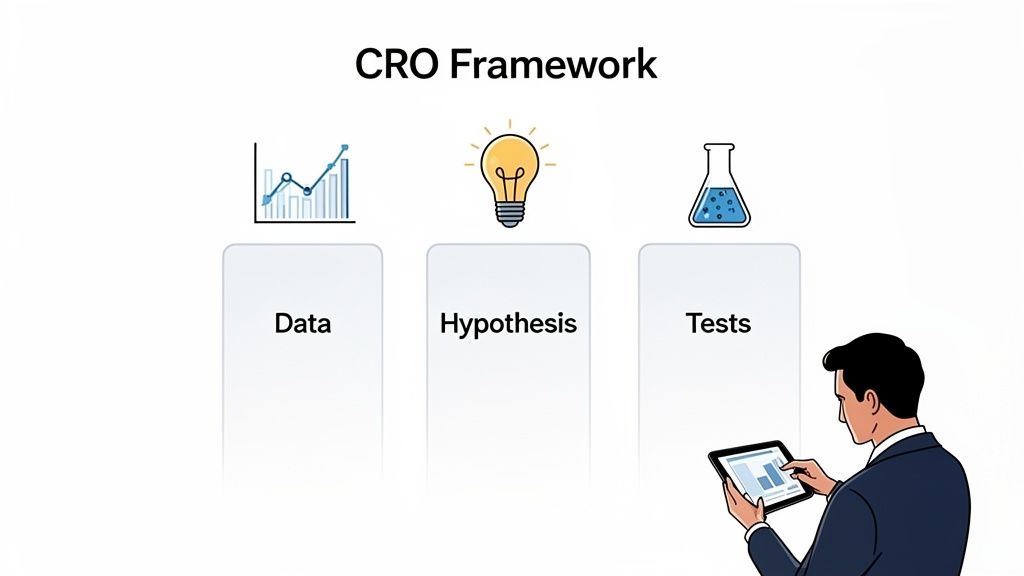
Real Conversion Rate Optimization (CRO) isn't about chasing shiny objects or arguing over button colors. It's about building a disciplined, repeatable process that turns the traffic you already have into more revenue. The most effective CRO programs boil down to a simple, powerful, three-part cycle.
The Three Pillars of Predictable Growth
High-growth companies treat CRO as a continuous loop, constantly refining their understanding of the customer to fuel growth.
- Analyze User Behavior: First, you must dig into your data to understand why users aren't converting. This goes beyond surface-level metrics. It requires a deep dive into analytics and tools like heatmaps to pinpoint where users drop off, what they click on, and how behavior differs between traffic sources.
- Form Data-Backed Hypotheses: Once you identify a problem area, you can form an educated, testable statement about how to fix it. A strong hypothesis is never vague. For example: "Changing our 'Request a Demo' CTA to 'See a 5-Min Product Tour' will increase sign-ups by 15% because it lowers the perceived time commitment for busy prospects."
- Execute Iterative Tests: Finally, you test that hypothesis with an A/B or multivariate test. This lets actual user behavior determine the winner, removing internal opinions and guesswork from the equation. Every test, win or lose, provides a valuable insight that feeds back into the analysis stage.
This simple, iterative loop is the core of how we drive measurable results.
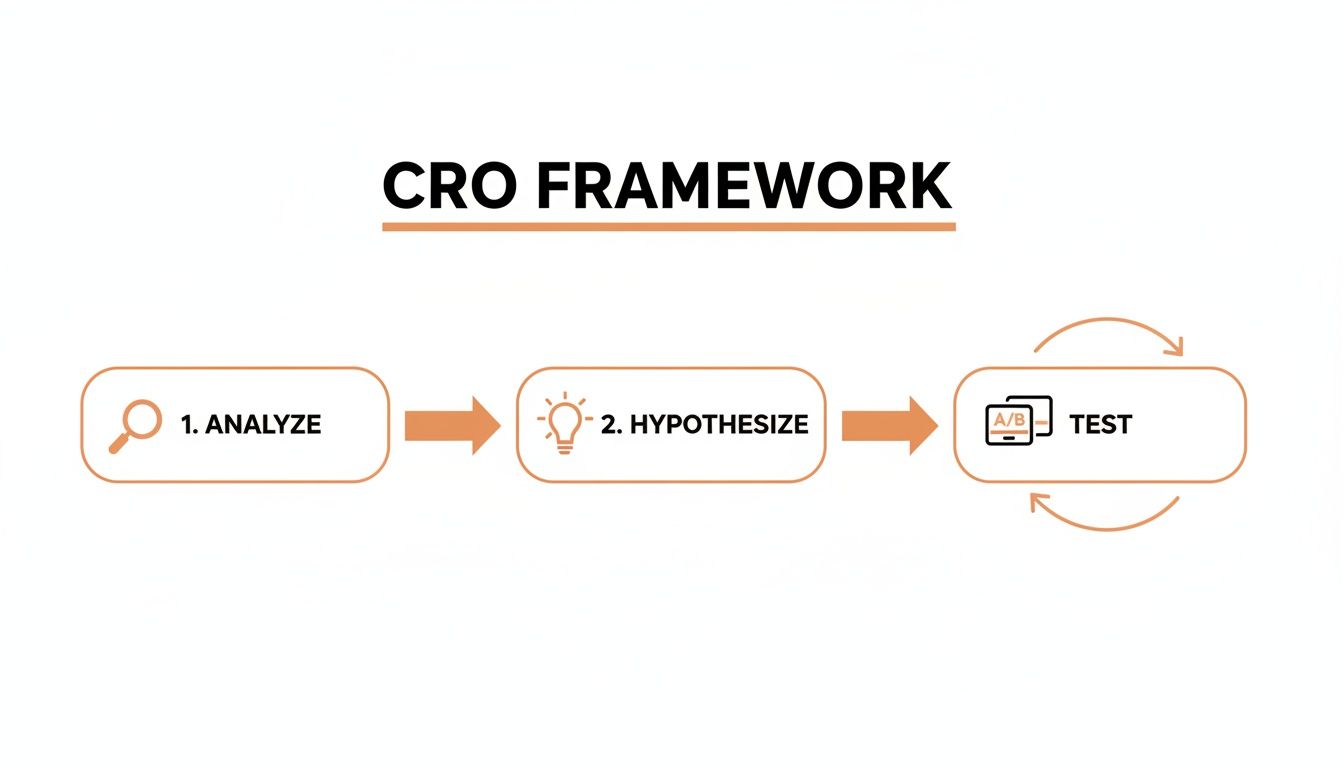
It's a cycle. Every test fuels the next round of analysis, creating a powerful engine for continuous improvement that directly impacts ROI.
Benchmarking Your Starting Point
Before you can improve, you need a clear baseline. While the average website conversion rate is often cited as 2.9%, this number is almost meaningless without industry context. A B2B SaaS company and an e-commerce brand have fundamentally different conversion goals and user journeys.
To give you a clearer picture, here are typical conversion rate benchmarks across different sectors. This helps you gauge whether you're in the right ballpark or if there's significant room for growth.
Industry Conversion Rate Benchmarks
Data sourced from various industry reports and reflects general performance.
Remember, these are just averages. The goal isn't just to meet a benchmark, but to create a system that consistently beats your own baseline, month after month.
A 0.5% lift in your conversion rate might sound small, but for a business with $10M in revenue, that can translate to an additional $500k—all without spending a single extra dollar on ads.
This foundational framework is exactly what we use at Ezca in our 90-day sprints. By focusing on this Analyze-Hypothesize-Test cycle, we deliver predictable growth for our clients. Our approach sets the stage for targeted improvements that yield measurable ROI. If you're looking to implement a more rigorous system, you might be interested in our dedicated conversion rate optimization services.
Finding the Hidden Money in Your Funnel
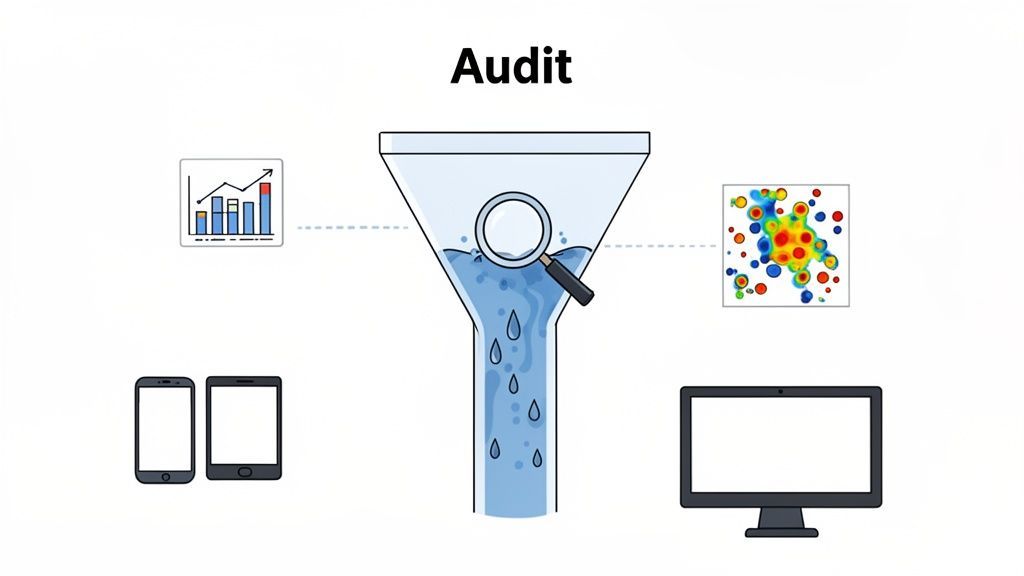
Your website is leaking revenue. Every visitor who leaves without converting is a missed opportunity. The first step in a serious CRO effort isn't guessing what to change; it's a forensic audit to find exactly where those leaks are happening.
A proper audit is a systematic way of measuring the drop-off between each stage of your sales funnel, moving from a high-level view down to specific problem areas.
Start with the Numbers: Mapping the User Journey
Before you can fix the leaks, you have to find them. This starts with a tool like Google Analytics 4. The goal is to map the primary conversion paths and identify the most significant drop-offs. Don't get lost in vanity metrics; build a clear funnel visualization report.
For an e-commerce store, a typical journey might be:
- Homepage → Category Page → Product Page → Add to Cart → Checkout → Purchase
For a B2B SaaS company, it's often:
- Blog Post → Features Page → Pricing Page → Demo Request Form → Thank You Page
Once mapped, problem areas become obvious. A 90% drop-off between the product page and "Add to Cart" is a massive red flag, indicating a serious issue with your product descriptions, pricing, or call-to-action.
Slice and Dice the Data to Find the 'Why'
An overall drop-off rate tells you what is happening, but segmentation tells you why. By filtering your funnel data, you uncover the specific friction points causing users to leave.
- By Traffic Source: Do visitors from LinkedIn ads abandon the demo form more than those from organic search? This could signal a mismatch between your ad copy and landing page message.
- By Device: Is your checkout abandonment rate 50% higher on mobile? Your mobile checkout is likely cumbersome, with tiny form fields and too many steps.
- By User Type: If new visitors fail to convert on a key page while returning visitors do, it suggests first-timers lack sufficient information or trust to proceed.
Every segment tells a story. A high mobile bounce rate from Instagram ads could mean your visually-driven traffic is hitting a wall of text on a slow-loading page, killing their momentum instantly.
Watch How People Actually Use Your Site
Quantitative data shows you where users drop off, but qualitative data shows you how. Behavior analytics tools like Hotjar or Lucky Orange let you see your site through your customers' eyes.
- Heatmaps: These visuals show where people click, move their mouse, and scroll. If your primary CTA is being ignored while a non-linked image next to it is covered in clicks, you've found a clear design flaw.
- Session Recordings: Watching anonymous recordings of real users struggling with your site is invaluable. You might see someone rage-clicking a broken button or wrestling with a confusing form. We saw this firsthand in a major e-commerce checkout optimization project where recordings revealed dozens of small but costly friction points.
- On-Page Surveys: Sometimes, the easiest way to get answers is to ask. A simple pop-up on a high-exit page asking, "What's preventing you from signing up today?" provides direct, unfiltered feedback you can act on immediately.
Combining the "what" from analytics with the "why" from behavior tools creates a powerful, data-backed roadmap. This is the essential diagnostic work we perform at Ezca before launching any optimization sprint, ensuring we focus on fixes that will actually move the needle.
From Problems to High-Impact Test Ideas
You’ve audited your funnel and found the leaks. Now, you must translate those problems into testable solutions. This is where many CRO programs falter, jumping straight into testing based on competitor actions or blog post advice.
A disciplined CRO program doesn't guess; it forms a clear, educated hypothesis first. A solid hypothesis is a structured statement that connects a proposed change to a measurable, expected outcome.
The best format is simple: “If we [implement this specific change], then [this specific metric] will improve because [this is the data-backed reason why].” This structure forces you to clarify the why behind your test and predict its impact, moving you from random tweaks to strategic experiments.
How to Write a Hypothesis That Works
Let’s translate the problems you uncovered in your audit into specific, measurable, and testable ideas tied directly to user behavior.
- SaaS Scenario: Your audit shows a huge drop-off on the pricing page. Session recordings reveal users hovering over feature lists, looking confused. A weak idea is, "Let's redesign the pricing page." A much stronger hypothesis is: "If we replace the feature checklist with a benefit-oriented headline for each plan, then demo requests will increase by 15% because users will better understand the specific value they get."
- E-commerce Scenario: Analytics show a spike in cart abandonment from mobile users at the shipping information step. A vague goal is to "make checkout easier." A powerful hypothesis is: "If we add trust badges and customer reviews above the fold on the mobile checkout page, then the cart abandonment rate will decrease by 10% because it will reduce anxiety about purchase security."
Each example links a specific action to a clear metric and a logical reason. This discipline is what separates programs that get lucky once from those that learn and improve with every test.
A winning test is fantastic, but a losing test built on a clear hypothesis is still incredibly valuable. It teaches you what doesn't work for your audience, refining your understanding and preventing you from making the same mistake twice.
Which Test Should You Run First?
You'll likely end up with a long backlog of great ideas. The challenge is deciding what to tackle first. A solid prioritization framework focuses your limited resources on the opportunities with the biggest potential payoff.
The P.I.E. framework is a simple yet effective scoring system that removes emotion from decision-making. You score each test idea against three criteria:
- Potential (P): How much improvement can this change deliver? A test on a high-traffic homepage has far more potential than a tweak on a low-traffic blog page.
- Importance (I): How valuable is the traffic to this page? An improvement on your checkout page is critically important, far more so than a change to your "About Us" page.
- Ease (E): How difficult is this test to implement technically and politically? A simple headline change is easy (score 10), while a complete checkout process overhaul is complex (score 1).
Score each hypothesis from 1 to 10 for each category and add them up for an objective ranking.
P.I.E. Hypothesis Prioritization Matrix
Use this matrix to score and rank your CRO test ideas based on Potential, Importance, and Ease.
Sorting your backlog by total score instantly reveals your quick wins and high-impact projects. This process removes subjective debates and aligns your team on the tests that will drive business results now.
Putting Your Hypotheses to the Test: Running Flawless A/B and Multivariate Tests
This is where your research meets reality. Launching conversion tests isn't just about tweaking design elements; it’s a disciplined method for collecting clean, reliable data to prove whether a change actually improves performance.
Without a proper testing framework, you're making business decisions based on noise, not evidence. The goal is to isolate a variable, show it to a segment of your audience, and measure the results against the original version (the control). It's the only way to know for sure that your change caused the lift.
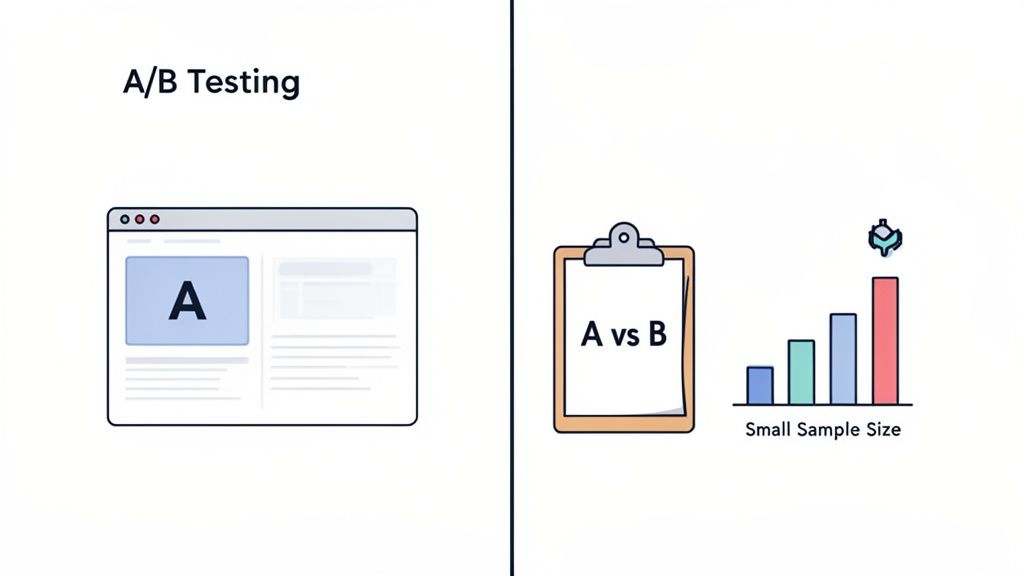
Starting Simple: Your First A/B Test
The most common method is an A/B test (or split test). You create two versions of a page: Version A is your control (the original), and Version B is the variation with your change. Traffic is split evenly between the two, and you measure which one achieves a better conversion rate.
For example, an e-commerce client of ours was debating which offer would be more profitable:
- Version A (Control): A banner offering "Free Shipping on Orders Over $50."
- Version B (Variation): The same banner with "15% Off Your Entire Order."
The 15% off coupon achieved a slightly higher conversion rate. However, the data showed the free shipping offer produced a 12% higher Average Order Value (AOV). For the bottom line, free shipping was the clear winner—an insight they never would have gained without a clean A/B test.
A common mistake is testing too many variables at once. If you change the headline, CTA, and image in a single variation, you have no idea which element made the difference. Real learning comes from isolating one variable at a time.
Understanding the Numbers That Actually Matter
Setting up a test in a tool like VWO or Optimizely is the easy part. Interpreting the results correctly is where the skill lies. Two concepts are non-negotiable: statistical significance and sample size.
- Statistical Significance: This is your confidence level. A result with 95% statistical significance means there's only a 5% chance the outcome was random luck. You cannot stop a test after a day or two just because one version is ahead. You must wait until you hit that confidence threshold.
- Sample Size: Your test needs to run long enough to gather data from a representative group of users. A test run only on a weekend might capture atypical behavior. A good rule of thumb is to run tests for at least two full business cycles—typically two weeks—to smooth out daily fluctuations.
Ignoring these principles leads to "phantom wins"—implementing changes that look good in the short term but have zero real impact on your business.
Avoiding Common Testing Pitfalls
A clean test requires vigilance against technical and strategic traps that can invalidate your results.
A classic technical issue is the "flicker effect," or Flash of Original Content (FOUC). This happens when the original page loads for a split second before the testing software swaps in the variation. It creates a poor user experience and contaminates your data. At Ezca, we often use server-side testing to bypass this, ensuring a seamless experience and pure data.
Strategically, a common error is obsessing over micro-conversions (like button clicks) instead of macro-conversions that affect revenue (like completed purchases). A flashy button might get more clicks, but if those clicks don't lead to more sales, it's a vanity metric. Always tie your test goals to the metrics that matter to your P&L.
Optimizing Landing Pages for Paid and Organic Traffic
Your landing pages are where conversions happen—or don't. They are the destination for all the traffic you're driving from paid ads and organic search. Their one job is to get the visitor to take action.
However, many campaigns fail by treating all traffic the same. A visitor who clicked a specific Google Ad has a different intent than someone who found you through a "how-to" blog post. Ignoring that difference is a surefire way to burn cash and lose potential customers.
The key is to create a seamless, hyper-relevant experience that feels like a natural continuation of the visitor's journey.
The Art of the Message Match for Paid Campaigns
For paid campaigns, the most critical rule is message match. The headline, copy, and offer on your landing page must perfectly mirror the promise made in your ad. Any disconnect creates instant friction and erodes trust, causing users to hit the back button.
Imagine a user clicks a Google Ad promising a "Free Trial of Business Accounting Software." If they land on a page with a generic headline like "Our Powerful Software Solutions," you’ve broken that promise and likely lost the conversion.
Strong message match doesn't just boost conversions; it improves your Google Ads Quality Score. A higher Quality Score leads to lower costs-per-click and better ad positions, directly impacting your campaign's ROI.
The only effective solution is to build dedicated landing pages for your campaigns. A user searching "business accounting software" should land on a page with the headline: "The #1 Accounting Software for Small Businesses – Start Your Free Trial." It's an instant confirmation they are in the right place.
Satisfying User Intent for Organic Traffic
Organic traffic is different. While some visitors are ready to buy, many more are in research mode. The secret to converting SEO traffic is to satisfy the specific user intent behind their search query.
- Informational Intent: Someone landing on your blog from a search like "small business tax tips" isn't ready for a hard sell. Instead, offer a softer conversion, like a downloadable "Tax Prep Checklist." Deliver value first to build trust.
- Transactional Intent: A visitor from a search like "buy business accounting software" is much further down the funnel. They need a page that makes it easy to see pricing, compare plans, and sign up for a demo or trial. Get out of their way and facilitate the conversion.
Optimizing for organic means building a content experience that guides users from awareness to decision. For a deeper look, see our guide on how to increase organic traffic by aligning content with search intent.
Personalization: The Ultimate Conversion Lever
The next level of optimization is dynamic personalization. This involves using technology to change page content based on who is visiting—their traffic source, past behavior, or industry. At Ezca, we use AI-powered tools to do this at scale with powerful results.
For example, a visitor from a LinkedIn ad targeting financial services professionals could see a headline: "The Accounting Software Trusted by Financial Advisors."
Simultaneously, a visitor from a Google Ad for "e-commerce accounting" would see: "Seamlessly Sync Your Shopify Sales with Our Accounting Platform."
It's the same page, but the experience is tailored to feel uniquely relevant. This level of personalization drives major lifts in engagement and conversions by making every visitor feel like the page was built just for them.
Measuring ROI and Scaling Your CRO Program
A successful A/B test is a great start, but to build momentum, you must translate that win into the language of the C-suite: revenue and ROI. An effective CRO program doesn't just celebrate conversion lifts; it proves its financial impact and makes a clear case for more investment.
This requires a shift from thinking about isolated tests to building a scalable, continuous growth engine that connects optimization work directly to the bottom line.
Beyond Conversion Rate: Calculating True ROI
A bump in conversion rate is a good start, but it doesn't tell the whole story. To calculate the true ROI of your CRO program, you must measure its impact on high-level business KPIs.
Track metrics like:
- Average Order Value (AOV): Did your test convince more people to buy and encourage them to spend more?
- Customer Lifetime Value (CLV): Are the new customers acquired through optimized funnels more valuable over time?
- Customer Acquisition Cost (CAC): By converting more of your existing traffic, you inherently lower the cost to acquire each new customer.
A winning test that boosts SaaS trial sign-ups by 20% is a success. But if you can also show that it increased the trial-to-paid conversion rate by 5%, you've connected your work directly to revenue. This positions CRO as a profit center, not a cost center.
Build a simple KPI dashboard to report on your program's success. Track the financial uplift from every winning test and present a cumulative ROI to stakeholders. This changes the conversation from "we ran a test" to "our optimization efforts generated an extra $50,000 in revenue last quarter."
Scaling Your Program: From One-Off Tests to a Growth Engine
Once you consistently prove ROI, it's time to scale. This means creating a systematic, repeatable process that makes testing a core part of your company's operations. It’s the data-driven approach we use at Ezca to generate over $100M in revenue for our partners—turning CRO from a tactic into a core business strategy.
Scaling often involves integrating CRO with other marketing channels. SEO and content marketing, for example, can dramatically increase the volume of qualified traffic entering your funnels. HubSpot ranks the website/blog/SEO trio as the #1 channel for ROI. With organic search traffic converting at an average of 2.7% across industries, it’s a powerful foundation to optimize. You can explore more marketing statistics to see how these channels compare.
By proving financial value and tying your efforts to other high-impact channels, you build an undeniable case for more resources. This is how you evolve from a single person running tests to a dedicated team driving predictable business growth.
Frequently Asked Questions About CRO
As leaders and teams invest in getting more from their website traffic, a few key questions consistently arise. Here are straight answers to the most common concerns.
How Long Until We See CRO Results?
This depends entirely on your website traffic volume. A high-traffic site can achieve a statistically significant test result in just a few weeks. Lower-traffic sites require more patience to collect enough data for a reliable conclusion.
However, a well-run CRO program always looks for quick wins. While a major test is running, you can often implement immediate improvements, like fixing a broken form or clarifying a confusing headline, to get an instant lift.
What Is a Good Conversion Rate to Aim For?
There is no magic number. While the cross-industry average is around 2-3%, this figure is almost meaningless without context. A "good" rate is entirely relative to your industry, business model, price point, and traffic source.
A B2B SaaS company might be thrilled with a 5% demo request conversion rate, while a luxury e-commerce brand could be highly profitable at a 1% purchase conversion rate.
The most important benchmark is your own. Instead of chasing a generic industry average, focus on systematically improving your current baseline. Aiming for a 20% lift on your existing conversion rate is a much smarter and more actionable goal.
What Are the Most Common CRO Mistakes?
Over years of practice, I've seen teams repeatedly fall into the same traps. Avoiding these common pitfalls is the first step toward building a successful program.
The biggest mistakes include:
- Testing without data: Launching tests based on gut feelings or a "great idea" from a team member. Effective CRO starts with a hypothesis backed by user data from your audit.
- Stopping tests too soon: It's tempting to call a winner the moment one variation pulls ahead, but this leads to false positives. You must wait for statistical significance.
- Focusing only on small changes: Don't get stuck in an endless loop of button color tests. The biggest impact comes from bolder experiments on your core value proposition, page layout, or offer.
A structured, disciplined framework is the best defense against these traps. It forces a strategic approach, ensuring your efforts lead to reliable and meaningful business results.
Ready to stop guessing and start building a predictable growth engine? The team at Ezca uses a data-driven, 90-day sprint methodology to help brands like yours systematically improve conversion rates and maximize ROI. Learn more about our CRO services.