Master Goals in Google Analytics for 2026 Growth
Goals in google analytics - Unlock growth with goals in Google Analytics. Define UA goals, migrate to GA4 conversions, and link tracking to performance marketin

Most marketing leaders already have Google Analytics installed, dashboards built, and weekly reports going out. The problem isn’t access to data. The problem is that the dashboard often answers easy questions and misses the one that controls budget.
You can see sessions, users, engagement, and traffic sources. But when the CFO asks which campaigns are producing pipeline, purchases, or qualified leads, those reports often go soft. They describe activity. They don’t prove contribution.
That gap is where goals in google analytics matter. Not as a settings menu. As a measurement system that tells you which user actions deserve budget, which channels deserve protection, and which campaigns should be cut inside a focused 90-day growth cycle.
Your Dashboard is Full of Data But Lacks Answers
A familiar pattern shows up in audit calls. Paid search is driving clicks. SEO traffic is growing. Social campaigns are getting engagement. The site looks active. Yet nobody can say, with confidence, which efforts are turning into revenue-producing actions.
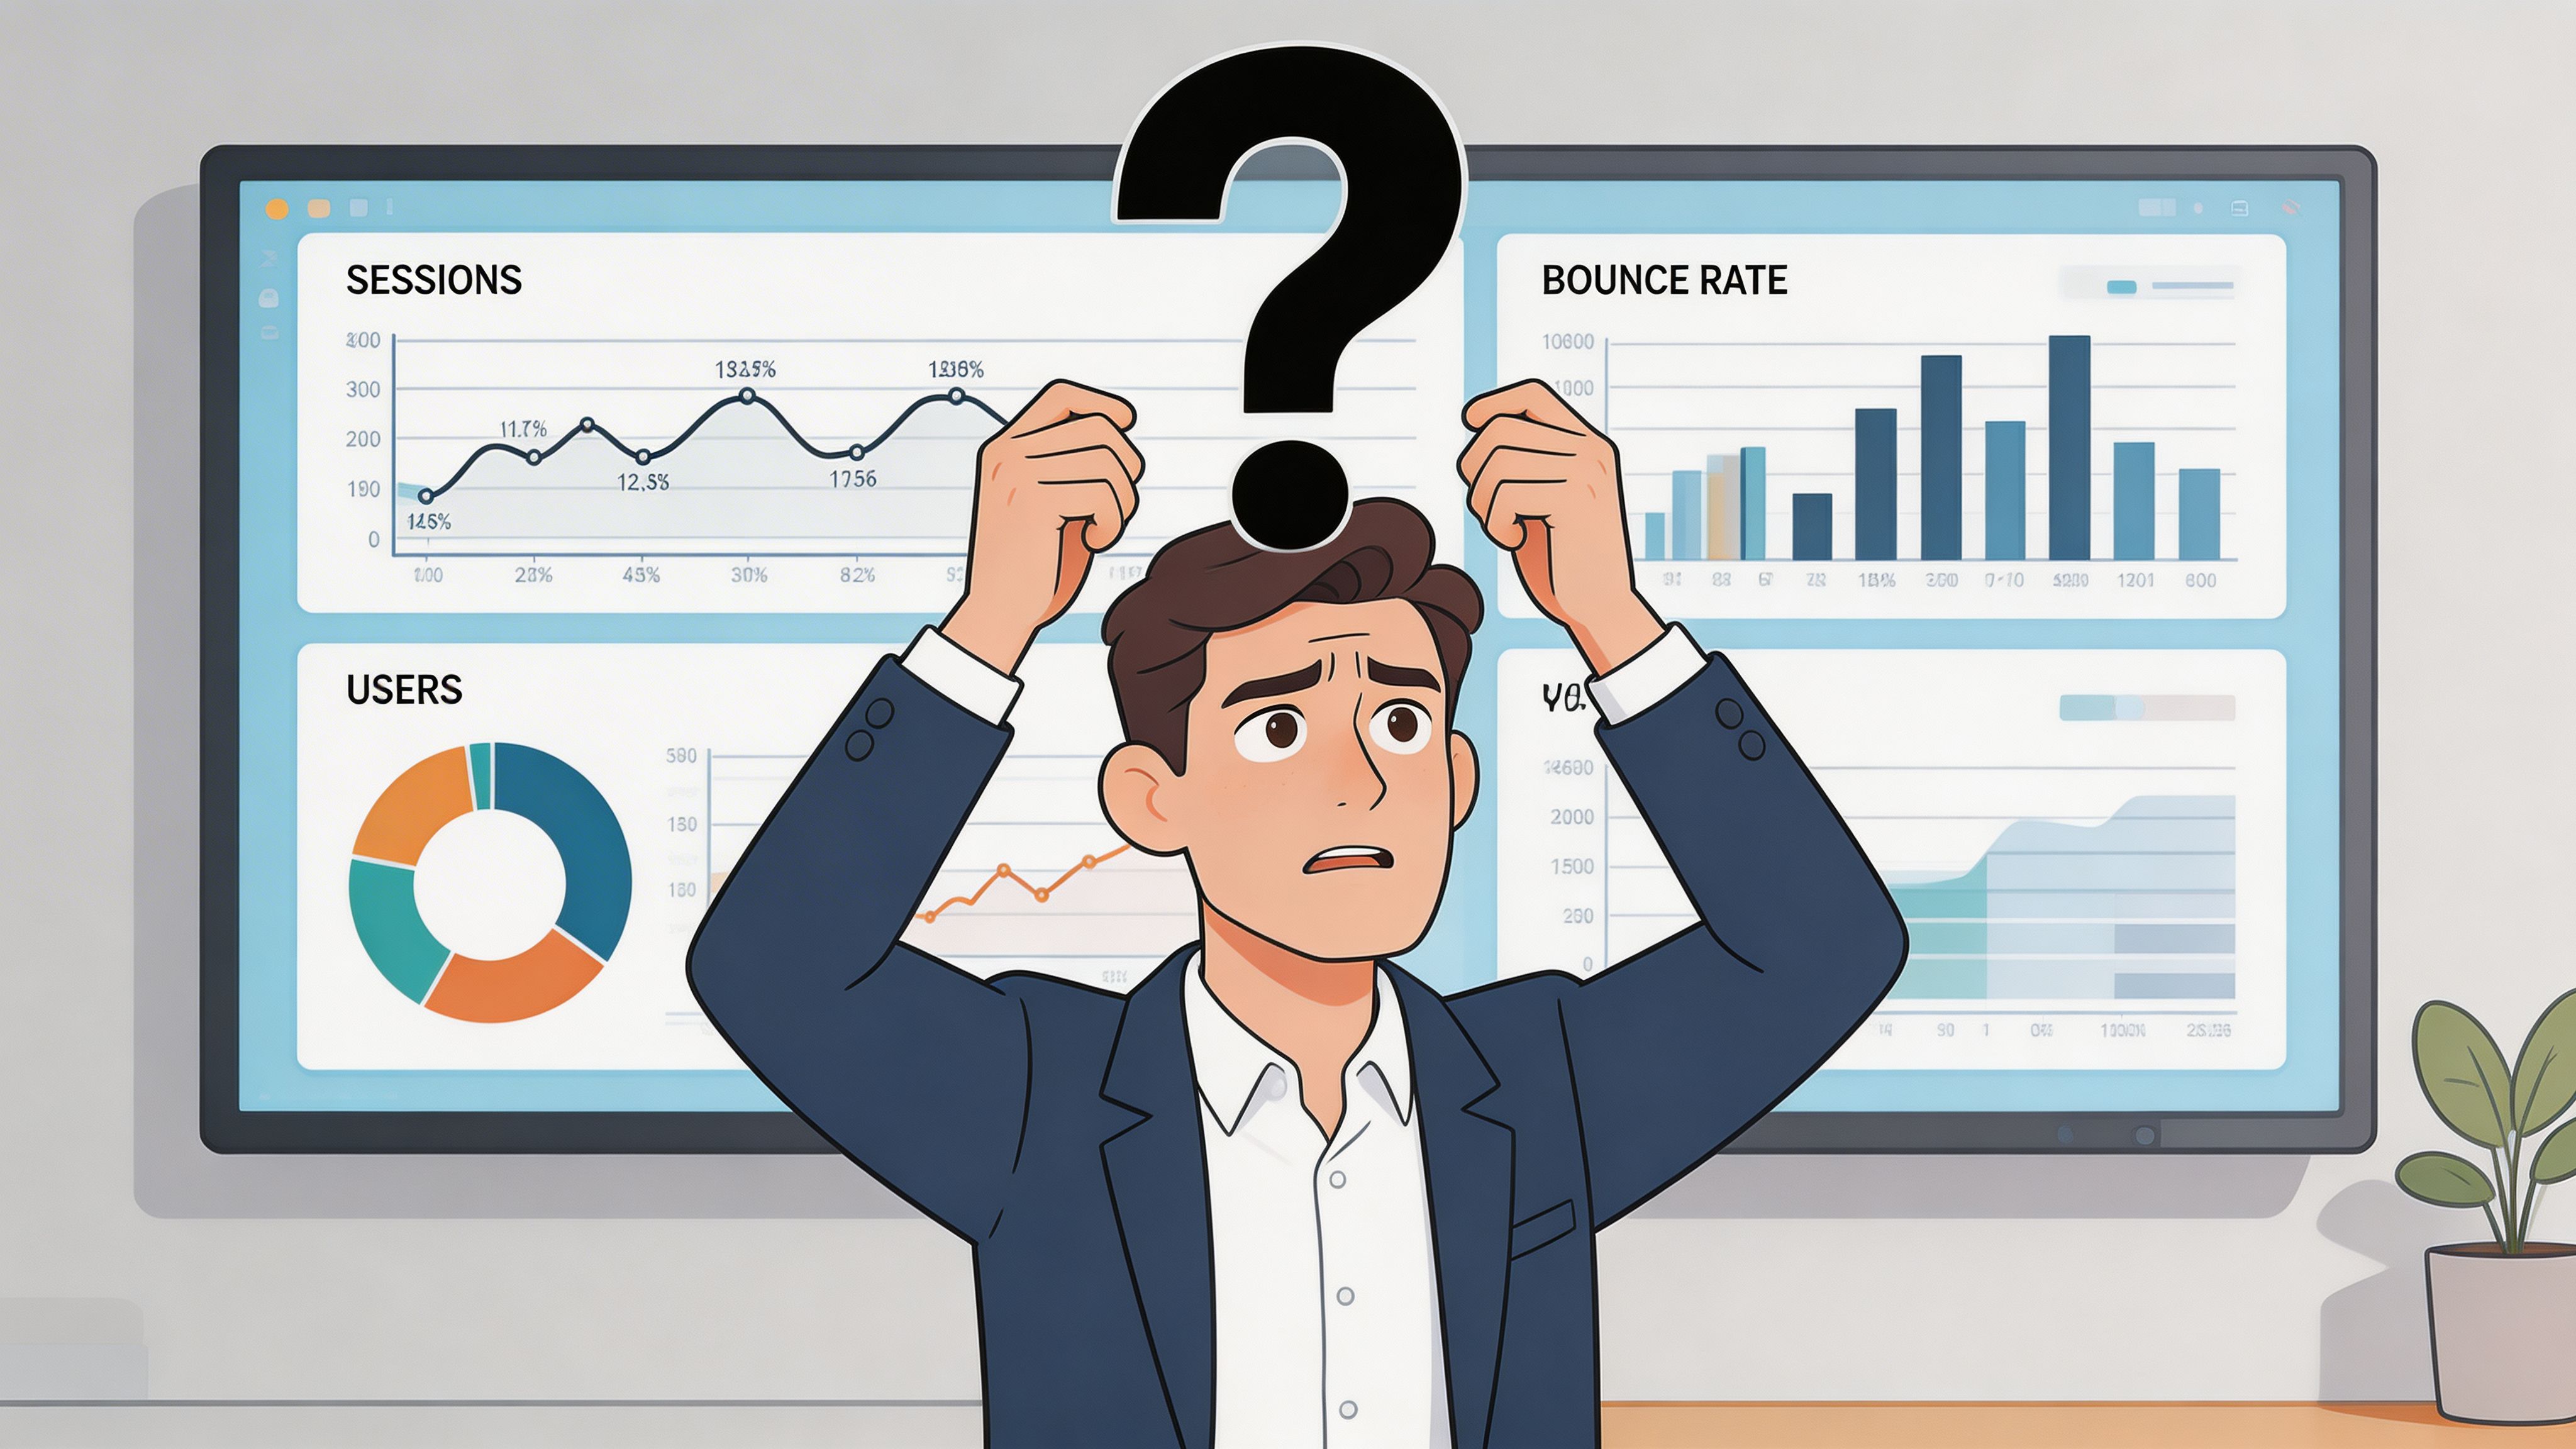
That usually happens because the account tracks traffic better than intent.
A dashboard full of page views won’t tell you whether a visitor booked a demo, started checkout, downloaded a pricing guide, or submitted a contact form. If those actions aren’t defined as meaningful outcomes, every channel starts to look vaguely useful. That’s where bad budgeting starts.
Vanity metrics don’t survive budget scrutiny
Marketing directors don’t get budget approved because a campaign generated attention. They get budget approved because a campaign generated outcomes tied to pipeline or sales.
Without clear goals, teams fall into a few traps:
- Overvaluing top-of-funnel traffic: Traffic grows, but the visitors don’t move deeper into the funnel.
- Undervaluing assist channels: SEO, email, or organic social often influence conversion before the final click.
- Optimizing creative for clicks instead of quality: Ads can look efficient while producing weak leads.
- Missing friction in the funnel: If nobody tracks key actions, nobody sees where intent drops.
Goals turn reporting into decision support
A proper goal framework changes the conversation. Instead of saying, “Paid social drove visits,” you can say, “Paid social drove newsletter signups but weak demo intent, so budget should shift toward the channels producing lower cost per qualified action.”
That’s a different level of control.
Practical rule: If a metric can’t help you reallocate spend, it shouldn’t be the centerpiece of your weekly performance review.
Goals also create a shared language across teams. Marketing cares about lead quality. Sales cares about booked conversations. Finance cares about efficiency. Analytics goals let everyone evaluate the same actions with the same definitions.
For teams running in 90-day cycles, that matters. You need fast feedback loops. You need to know which micro-conversions signal future revenue, which macro-conversions prove it, and which channels are only creating noise.
Understanding Goals in Universal Analytics The Foundation
Universal Analytics is gone, but its logic still matters because many measurement plans were built there first. If you’ve inherited an old reporting setup, or you’re translating historical data into a new GA4 model, you need to understand what UA was trying to measure.
In UA, goals acted like digital signposts. You picked the actions that mattered, and Analytics counted how often users reached them. Users could configure up to 20 goals per reporting view, organized into sets of up to 5 goals each, and those goals were limited to four types: Destination, Duration, Pages/Screens per Session, and Events according to Google’s Universal Analytics goals documentation. That structure helped teams compare channels using Goal Conversion Rate and Cost Per Conversion, and it supported performance programs that generated over $100M in tracked e-commerce revenue.
Destination goals measured completion
This was the most straightforward UA goal type.
If someone reached a specific URL, UA counted a goal completion. Teams commonly used this for thank-you pages, order confirmations, or booked-demo confirmation screens.
A simple B2B example:
- Ad click lands on a service page
- Visitor fills out a demo form
- Site redirects to
/thank-you-demo - UA counts that page as a completed goal
That sounds basic, but it answered an important business question: How many people completed the action we asked for?
Destination goals worked well when the user journey ended on a unique page. They worked badly when the action happened inside a modal, single-page app, or JavaScript interaction with no clean URL change.
Duration goals measured engagement quality
Duration goals tried to identify people who stayed long enough to suggest meaningful interest.
That was useful for publishers, content-heavy sites, and education flows where attention mattered before conversion. If a user spent enough time on site, UA could count that as a goal.
The trade-off was obvious. Time on site isn’t the same as commercial intent.
Someone can keep a tab open and walk away. Another visitor can find what they need fast and convert without spending much time. Duration goals were useful as supporting indicators, not as the final proof of performance.
A long session can signal interest. It can also signal confusion. Don’t mistake attention for progress.
Pages per session goals tracked exploration
This goal type counted users who viewed at least a minimum number of pages in a session.
For content sites, large catalogs, or ad-supported properties, this offered a rough measure of depth. It was also a way to spot whether visitors were browsing broadly or bouncing after one page.
The issue was similar to duration goals. More page views don’t automatically mean better outcomes.
Sometimes more pages means a healthy research process. Sometimes it means users couldn’t find the answer on the first page. Good analysts always paired this goal with actual conversion actions before making budget decisions.
Event goals captured interaction
Event goals were UA’s attempt to go beyond page loads.
If a user clicked a button, played a video, downloaded a file, or interacted with an element on the page, that event could become a goal. This was a big step forward because it let teams measure behavior that didn’t create a new URL.
Examples included:
- CTA clicks: “Request pricing” button clicks
- Lead magnets: PDF downloads or webinar registrations
- Media engagement: Video starts or milestone views
- Navigation behavior: Clicks on outbound or support links
Expanded measurement made many mature UA setups more useful. Instead of waiting only for final conversions, teams could watch the smaller actions that moved users toward them.
What UA got right and where it broke down
UA’s structure forced discipline. With only a limited number of goal slots, teams had to decide what mattered. That often improved reporting hygiene.
But the model was rigid. A modern funnel rarely fits neatly into four boxes.
Here’s the practical summary:
UA taught marketers to define outcomes. That lesson still holds. What changed is the way Google Analytics now captures them.
The Big Shift From UA Goals to GA4 Conversions
The jump from UA to GA4 wasn’t a cosmetic update. It changed the measurement model underneath the platform.
In GA4, the old session-based goal structure was replaced by an event-driven model. According to this GA4 goals overview from Sugar Pixels, GA4 allows up to 30 conversions, now called Key Events, per property, which is a 50% increase from UA’s 20-goal limit, while also supporting up to 500 events total. The same source notes that early adopters saw a 15% uplift in conversion accuracy because GA4 handles cross-device tracking more effectively.
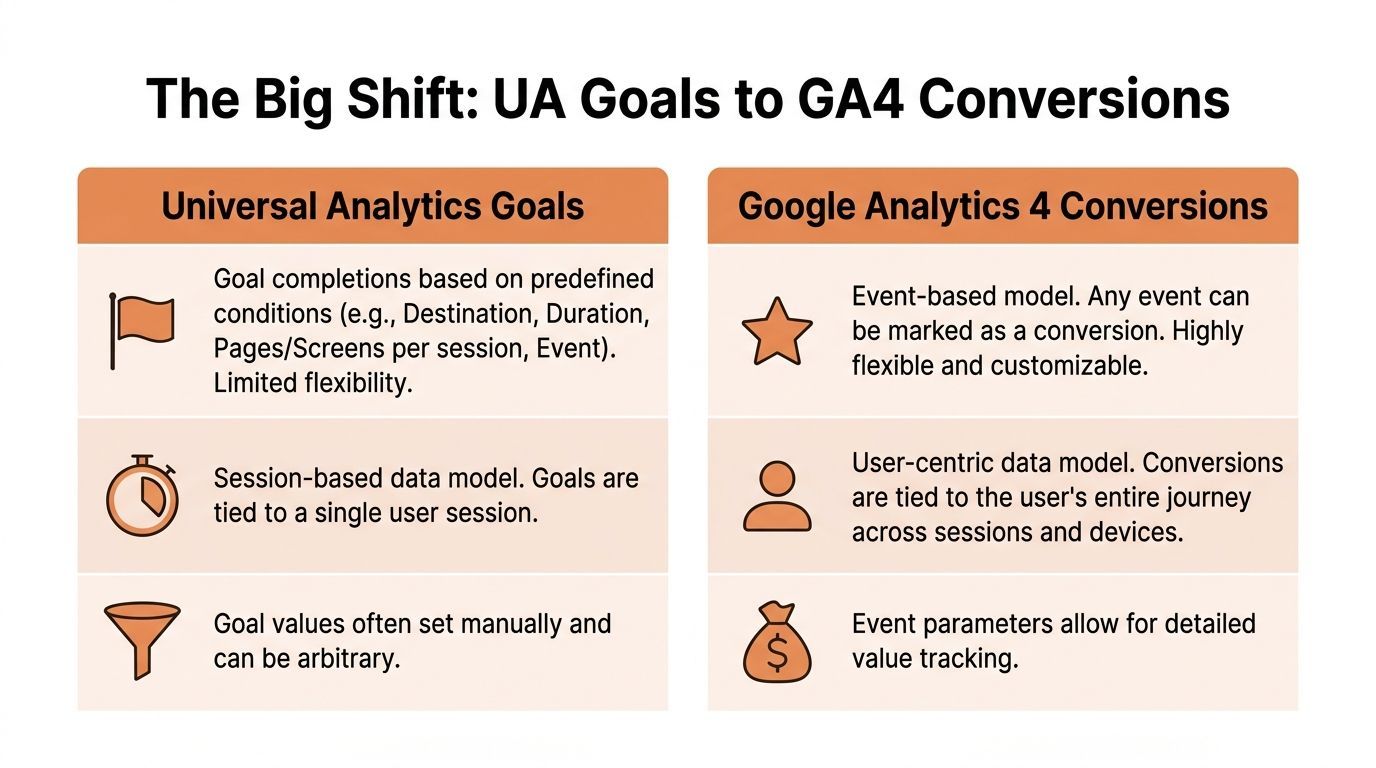
That change matters because customer journeys don’t happen in one clean session anymore. A buyer might click a paid ad on mobile, come back through organic search on desktop, then convert later through direct traffic. UA struggled with that behavior. GA4 was designed for it.
In GA4 everything starts as an event
Page views are events. Scrolls are events. Form submissions are events. Purchases are events.
A Key Event is an event you’ve decided is important enough to represent success.
That sounds small, but it changes how you build a measurement plan. You’re no longer asking which of four goal templates fits your business action. You’re asking which user interactions matter most, then marking those as key events.
This gives marketing teams far more flexibility.
For example, a SaaS team can track:
sign_upbook_demostart_trialpricing_cta_clickcontact_sales
An e-commerce brand can track:
view_itemadd_to_cartbegin_checkoutpurchase
A B2B team can track:
generate_leadwhitepaper_downloaddemo_requestform_start
Why this shift improves budgeting decisions
The biggest strategic advantage isn’t convenience. It’s better attribution for real buying behavior.
GA4’s model is much better suited to multi-touch journeys, especially when you’re trying to justify spend across SEO, paid search, paid social, and email at the same time.
If one channel creates first-touch interest and another closes, you need a reporting model that doesn’t flatten the journey into one session. GA4 does a better job of preserving that path.
That’s why the setup choice matters. If you only mark final purchases or demo submissions as key events, you’ll still miss a lot of what shapes revenue. If you mark every tiny interaction, your reports become noisy.
The right answer is usually a layered model:
GA4 is more flexible, but it’s easier to misuse
The old UA limits forced restraint. GA4 gives you room, but room can create clutter.
What doesn’t work:
- Marking every event as valuable
- Using vague event names nobody understands
- Tracking a button click without context
- Letting paid media and analytics teams use different conversion definitions
What works better:
- Define a short list of business-critical outcomes
- Separate macro and micro events
- Attach useful parameters where possible
- Review key events weekly, not once per quarter
If your key event list reads like a tag manager export, the setup is too messy to steer budget.
If you need a practical reference for implementation details beyond the native interface, Google Analytics Event Tracking gives a useful external walkthrough of how event-based tracking works in connected tools.
The real trade-off
GA4 is more powerful than UA for modern performance marketing. It also demands more discipline.
UA gave you categories first and business logic second. GA4 flips that. You need the business logic first.
That means your team has to answer harder questions:
- Which actions indicate revenue potential?
- Which actions only indicate curiosity?
- Which channels drive the highest-quality key events?
- Which events belong in dashboards, and which belong only in analysis?
When teams answer those questions well, goals in google analytics stop being a reporting feature and become a budget control system.
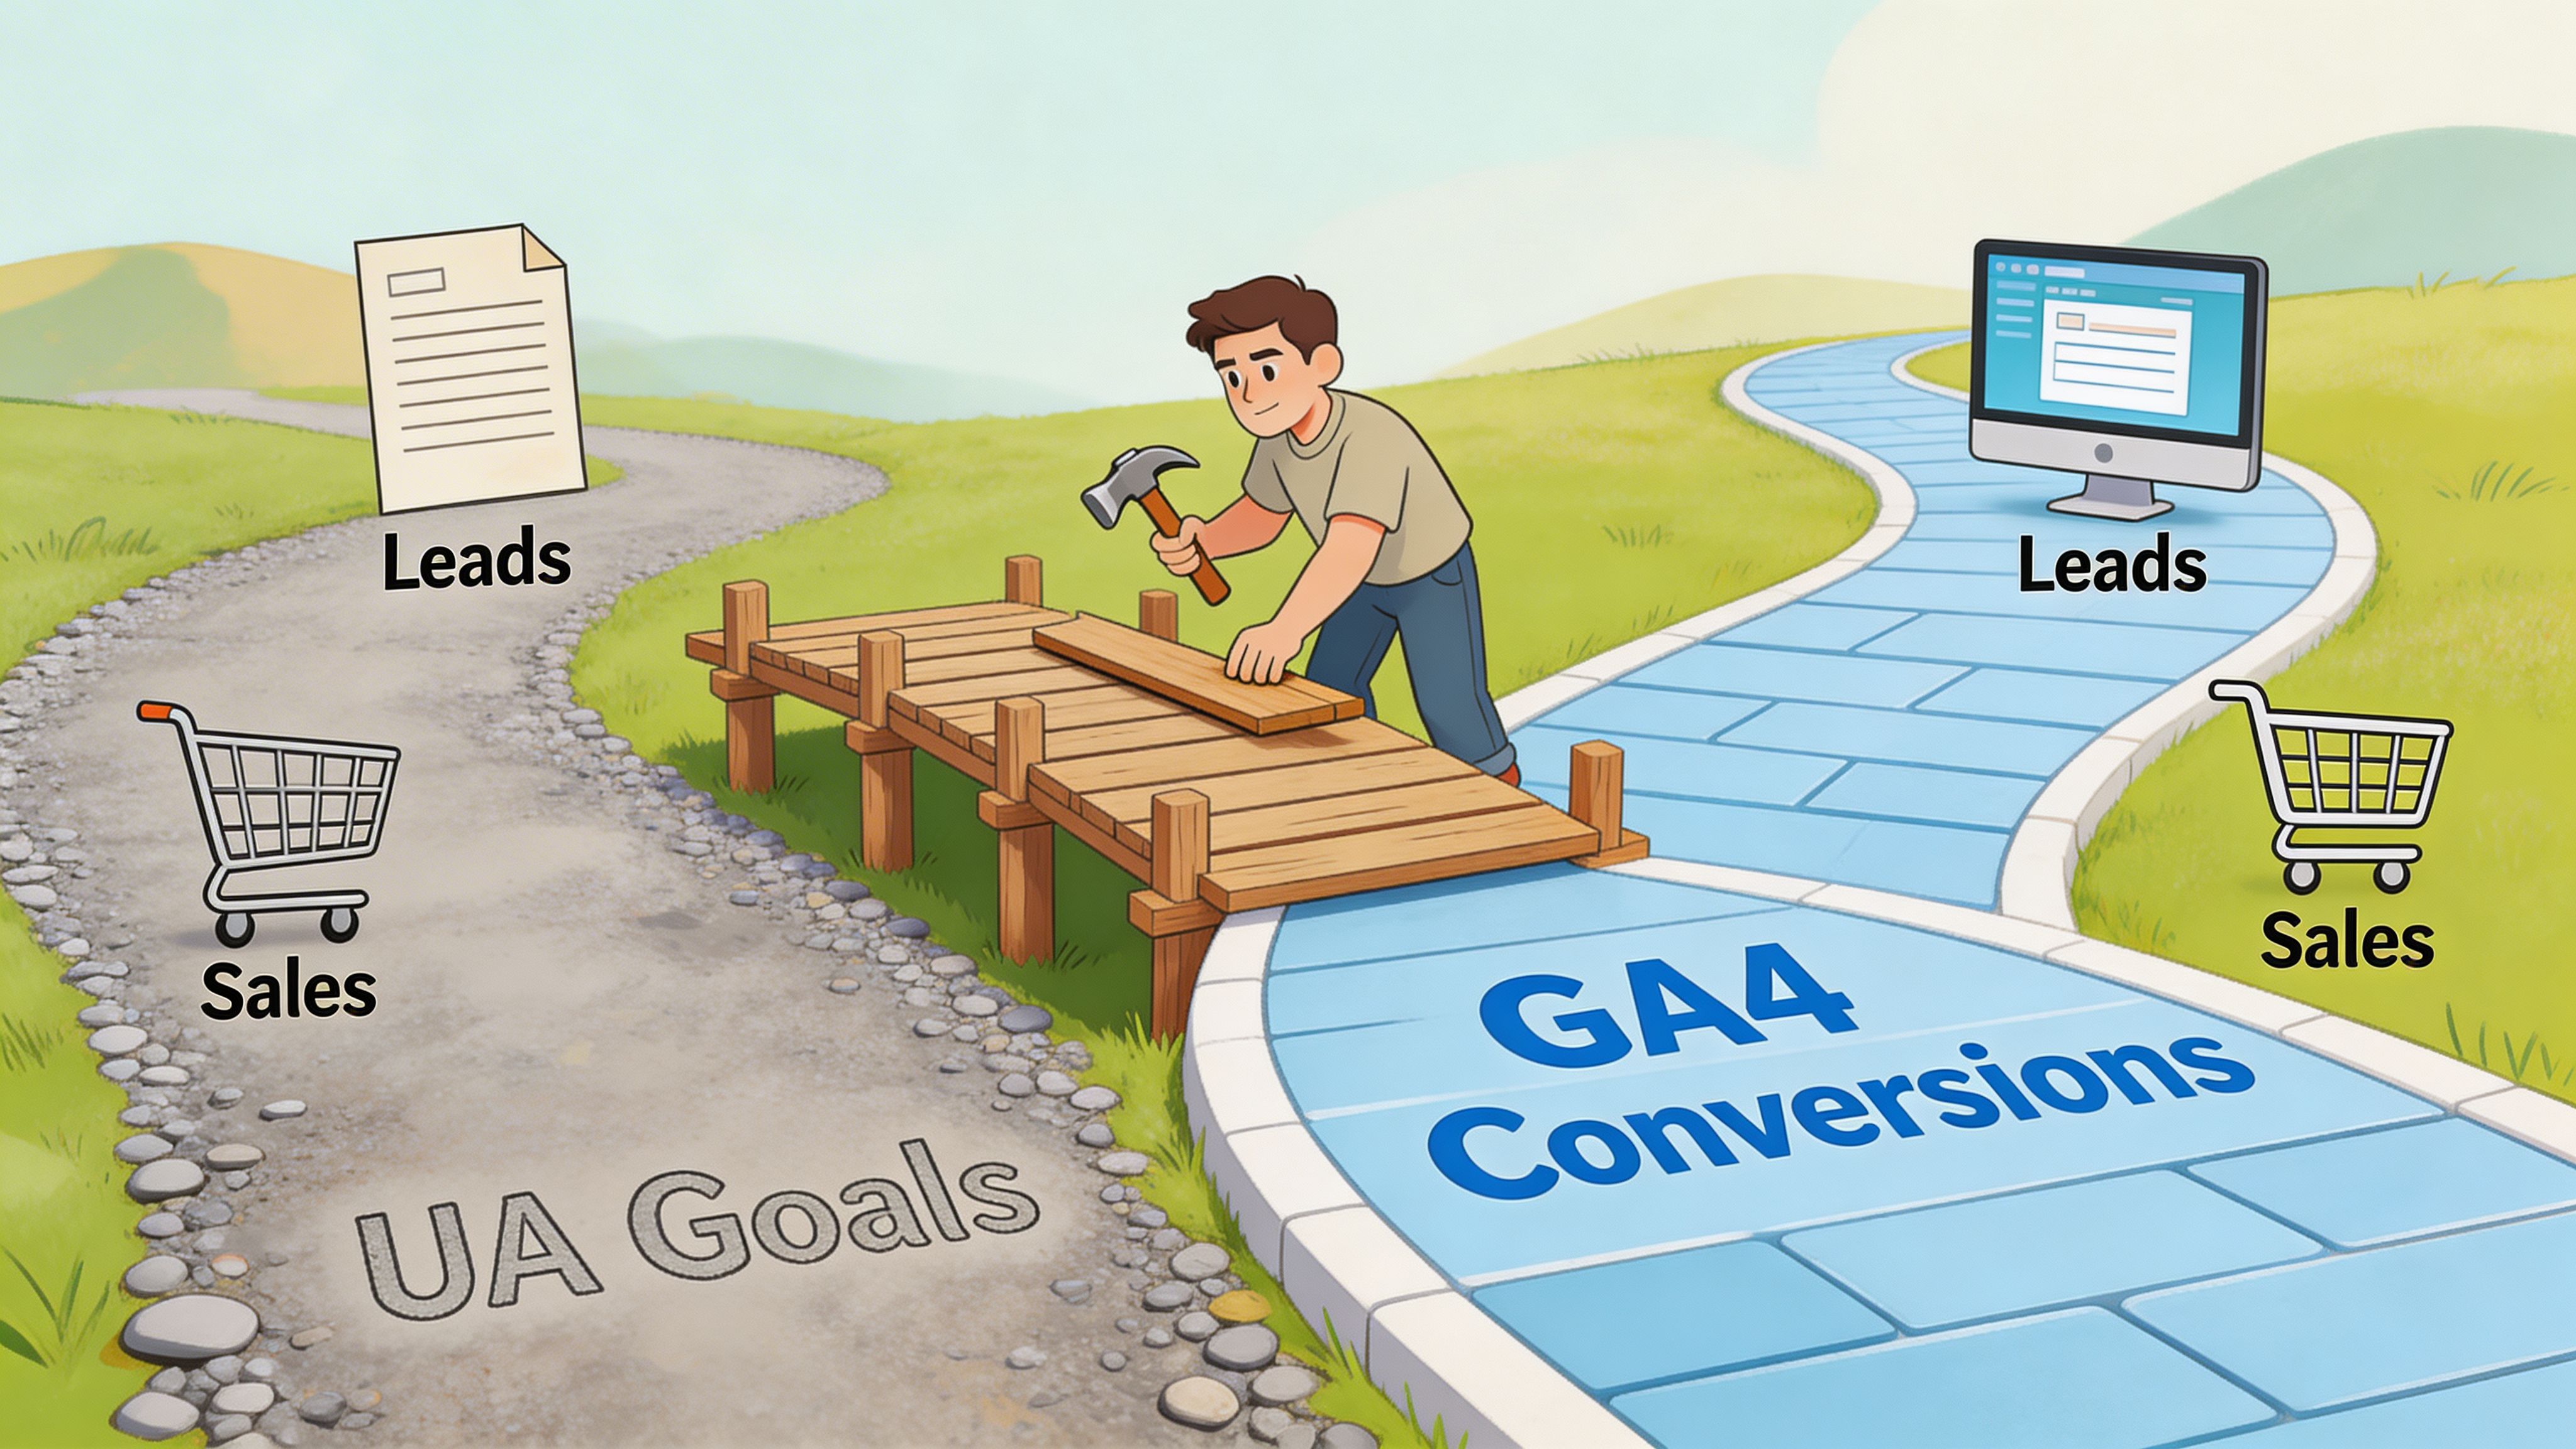
A Practical Framework for Mapping UA Goals to GA4
Migration gets messy when teams treat it like a one-to-one technical import. It isn’t. The better approach is to preserve the business intent behind each old goal, then rebuild that logic with GA4 events and key events.
According to WebFX’s explanation of GA4 goals, GA4 key events support a more flexible event-based model, and custom parameters can be attached to events for deeper funnel analysis. Their example of a SaaS demo booking event tied to pricing-page abandonment shows why this matters. The setup can expose drop-off patterns that older UA funnel visualizations often missed.
Start with a simple decision rule
Before you map anything, ask one question:
Was the UA goal measuring a page load, a behavior, or a proxy for interest?
That answer tells you how to rebuild it.
Mapping Destination goals
This is usually the cleanest migration.
Before in UA:/thank-you-demo counted as a lead goal.
After in GA4: create or identify an event that fires when the thank-you page is reached, then mark that event as a key event.
For some sites, the native page_view event is enough. For others, especially where routing is messy, it’s better to create a dedicated event such as demo_request_complete.
That naming choice matters. A specific event is easier to report on than a filtered page view.
Mapping Event goals
In this aspect, GA4 feels more natural than UA.
Before in UA: button click on “Start Free Trial” tracked as an event goal.
After in GA4: send a start_trial_click event, or a cleaner funnel event such as trial_started if the action reflects an actual completed step, then mark the meaningful one as a key event.
The practical mistake here is tracking only clicks. Clicks show interest, but they don’t always show completion.
For lead generation and trial funnels, I usually separate these actions:
cta_clickform_startform_submitdemo_booked
That lets the team see where intent breaks.
If your funnel has visible friction, a dedicated conversion rate optimization service often matters more than adding another traffic source, because a cleaner measurement plan reveals where your existing spend is leaking.
Mapping Duration goals
Duration goals rarely deserve a direct copy.
In most cases, you don’t want to recreate “spent X time on site” as a key event. You want to identify the behavior that meaningful engagement produces.
A stronger replacement might be:
- Scroll depth on a long-form service page
- Video engagement on a product explainer
- Reaching a pricing page after reading a feature page
- Form start after consuming gated content
That gives you a behavioral signal, not just a time signal.
Field note: When teams migrate duration goals directly, they usually preserve the weakest part of the old setup and miss the chance to improve it.
Mapping Pages per session goals
This UA goal type was often a proxy for curiosity. In GA4, build a cleaner proxy.
Instead of counting “five pages in a session,” identify what a high-intent exploration path looks like. A user who moves from blog content to solutions pages to pricing likely matters more than a user who bounces across support pages.
You can represent that in GA4 with events and parameters tied to content groups, page paths, or specific step completions.
Here’s a practical before-and-after view:
A short walkthrough can help if your team is rebuilding the setup from scratch:
Preserve intent, not the old structure
The strongest migrations don’t copy UA mechanically. They ask what the original goal was meant to prove, then implement that proof more cleanly in GA4.
That usually leads to a smaller, sharper set of key events:
- Final revenue or lead actions
- Mid-funnel actions that predict those outcomes
- Diagnostic interactions that explain drop-off
When you build it this way, the new setup doesn’t just replace old reporting. It improves how the team finds conversion blockers and reallocates budget.
Goal Templates for SaaS E-commerce and B2B
Teams generally do not need more event ideas. They need a shortlist of actions that connect directly to revenue decisions.
The easiest way to build goals in google analytics is to start with your business model, then separate macro-conversions from micro-conversions. Macro-conversions prove business value. Micro-conversions explain how users move toward that value.
SaaS template
A SaaS company usually has a longer consideration cycle, multiple touchpoints, and a mix of product-led and sales-led conversion paths.
A typical setup for a product with free trial and demo motion might include:
start_trialfor users who enter the product funnelbook_demofor sales-qualified intentpricing_cta_clickfor high-interest visitorsform_starton demo or contact formsnewsletter_signupwhen content is part of nurture
A practical example helps. Think of a SaaS brand selling workflow software to mid-market teams. Organic content drives first-touch traffic. Paid search captures category demand. LinkedIn campaigns support retargeting.
In that setup, book_demo is the macro-conversion. pricing_cta_click and form_start are the signals that help explain whether traffic is moving toward a sales conversation or stalling before it.
That’s also why SaaS teams need channel analysis tied to role and funnel stage, not just top-line traffic. If your company operates in that model, this overview of SaaS marketing is relevant because it reflects how growth programs usually combine SEO, paid media, and conversion strategy rather than treating them as separate silos.
Track the action that sales cares about, then track the smaller actions that tell you why that result is rising or falling.
E-commerce template
E-commerce is more transactional, but the same principle applies. The tracking plan should show where purchase intent strengthens and where checkout friction appears.
A clean baseline usually includes:
view_itemto confirm product interestadd_to_cartto measure shopping intentbegin_checkoutto identify serious buyerspurchaseas the primary macro-conversionnewsletter_signupif email is a real retention and remarketing channel
For a retail brand, purchase gets the executive attention. But budget shifts often happen because of the events before the purchase.
If paid social produces plenty of view_item activity but weak add_to_cart, the issue may be audience quality or product-page clarity. If paid search drives strong begin_checkout volume but poor purchase completion, the issue may be shipping visibility, checkout UX, or offer friction.
That’s why e-commerce teams shouldn’t rely on revenue alone. Revenue is the scoreboard. The supporting events tell you where to intervene.
B2B template
B2B lead generation often has the noisiest analytics setup because not every form fill is equal, and not every visitor is ready for sales.
A more useful event mix often includes:
demo_requestfor direct sales intentcontact_form_submitfor inbound interestwhitepaper_downloadfor nurture-stage engagementform_startto identify friction before completionpricing_page_viewas a high-intent behavioral signal
Take a B2B service firm running search, SEO, and retargeting campaigns. Search may drive bottom-funnel leads. SEO may pull in educational traffic. Retargeting may assist return visits.
In that environment, counting all form submissions equally leads to bad budget choices. A whitepaper download is useful, but it shouldn’t compete with a demo request in executive reporting. The right move is to keep both events, then classify them differently in reporting and review.
A practical way to organize the template
Use this structure inside GA4 and your weekly reporting deck:
| Business model | Macro-conversion | Mid-funnel event | Diagnostic event |
|---|---|---|
| SaaS | book_demo or start_trial | pricing_cta_click | form_start |
| E-commerce | purchase | begin_checkout | add_to_cart |
| B2B | demo_request or contact_form_submit | whitepaper_download | pricing_page_view |
What usually fails
The most common setup errors aren’t technical. They’re strategic.
- Too many “important” events: If everything is important, reporting loses hierarchy.
- Only final conversions tracked: You can’t diagnose funnel drop-off with final actions alone.
- No sales feedback loop: Marketing reports conversions that sales doesn’t value.
- Weak naming conventions: Teams can’t tell the difference between a click, a start, and a completed action.
The best template is the one your team can use every week without debating what the numbers mean.
Validating and Measuring Goal Performance for ROI
A conversion setup isn’t finished when the event appears in GA4. It’s finished when you trust the data enough to move budget because of it.
That trust starts with validation.
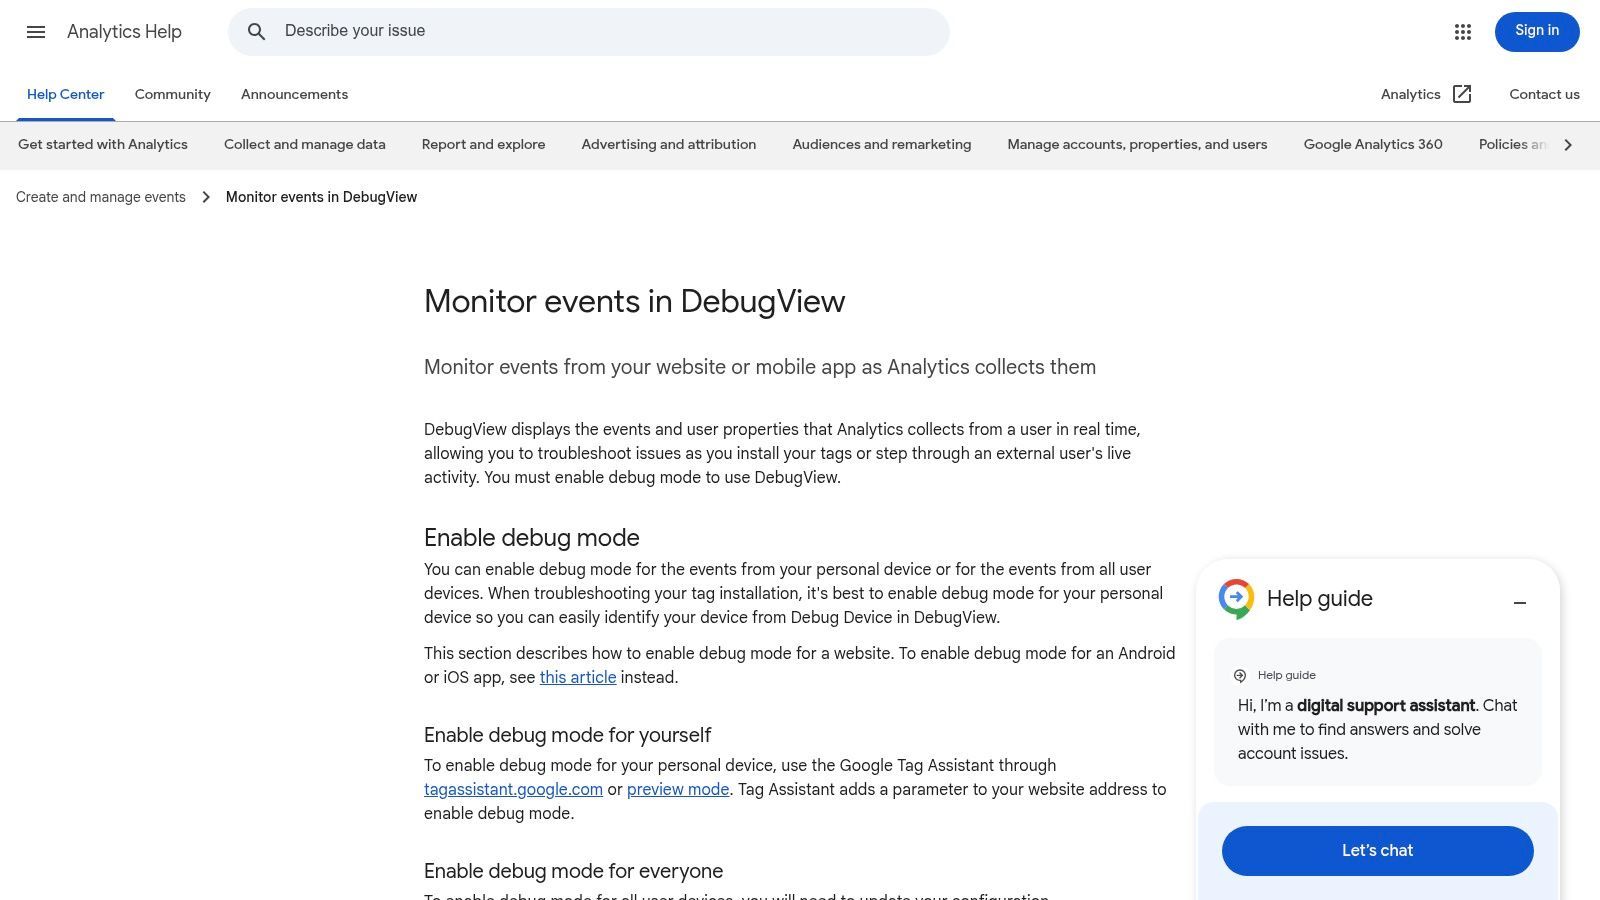
Validate before you report
GA4’s DebugView is the first checkpoint. Use it to confirm that the right event fires, with the right name, at the right moment.
You’re not just checking whether an event exists. You’re checking whether the business logic is correct.
For example:
- A form click should not be mistaken for a successful form submission
- A purchase event should not fire on page refresh
- A thank-you page event should not trigger for internal team testing
- A lead event should reflect the actual completed form, not a partial interaction
If the event logic is wrong, every downstream report is wrong.
Build reporting around economic questions
Once validation is solid, the next job is making the data useful for budget decisions.
A strong weekly reporting view usually includes:
- Channel-level key events
- Conversion rate by channel
- Cost per conversion
- Landing page contribution
- Assisted conversion patterns
Many teams often stall at this stage. They track conversions, but they still review channels in isolation. That misses how the funnel works.
The better approach is to compare what each channel does at different stages:
If you need an outside benchmark framework for framing expectations, this guide on what is a good website conversion rate is useful as a directional reference. The key benchmark, though, is your own qualified conversion economics by channel and landing page.
Use goals to run weekly budget shifts
The analytics setup transforms into a performance system through these actions.
In a disciplined 90-day cycle, the team should review conversion quality and channel efficiency weekly, not just monthly. If paid search is producing stronger demo requests while organic content is generating earlier-stage form starts, both channels may deserve investment, but for different roles in the funnel.
That’s also why content and SEO performance shouldn’t be judged only by last-click leads. Supporting pages often move users toward conversion before the final visit. A stronger organic landing page strategy can improve assisted outcomes over time, especially when paired with work like this guide on how to increase organic traffic.
The point of conversion tracking isn’t to admire the report. It’s to change spend, pages, offers, and campaigns while the quarter is still recoverable.
What ROI analysis should actually answer
At minimum, your setup should help answer four questions:
- Which channels produce the most valuable key events?
- Which landing pages turn traffic into intent?
- Where does the funnel lose qualified users?
- Which budget shifts are justified this week, not next quarter?
When the reporting can answer those clearly, goals in google analytics become operational. They stop being a passive dashboard feature and start acting like a control layer for spend.
Conclusion Turning Data into Decisions
Goals in google analytics matter because they turn marketing activity into business evidence.
UA gave teams a structured way to define outcomes. GA4 gives teams a more flexible model built around events and key events. The technical details matter, but the strategic use matters more. A clean setup helps you separate curiosity from buying intent, identify funnel friction early, and defend budget with something stronger than traffic trends.
The teams that get the most value from analytics don’t stop at implementation. They validate the data, review it weekly, and use it to make channel, landing page, and offer decisions inside the quarter.
If your reporting still tells you what happened but not what to fund next, the setup isn’t finished.
If you want a partner that treats analytics as a growth operating system, Ezca Agency helps SaaS, e-commerce, and B2B brands turn tracking into action. We work in focused 90-day sprints, align SEO, paid media, CRO, content, and reporting around real conversion signals, and help teams make budget decisions with more confidence.