How to Calculate Marketing ROI: A Guide for Leaders and Business Owners
Learn how to calculate marketing roi with proven formulas, attribution models, and practical tips for 2026.

The standard marketing ROI formula is probably lying to you.
The classic calculation, (Sales Growth - Marketing Cost) / Marketing Cost, is a common starting point. But relying on it alone is like navigating with a broken compass—it gives you a direction, but it's dangerously wrong. It can make you feel great about your spending while you're actually burning cash. This guide is for leaders who demand more than vanity metrics; it's about connecting marketing spend to real, defensible business growth.
The ROI Formula Everyone Uses Is Wrong. Here's Why.
Most business owners know the basics of how to calculate marketing ROI. You invest $10,000 in a campaign, and sales increase by $50,000. The math seems simple: ($50,000 - $10,000) / $10,000 equals a 400% ROI. A huge win, right?
Not so fast. This is where many well-intentioned marketing leaders make a critical error. That formula assumes your campaign was responsible for every single dollar of that sales growth. But what about the revenue you would have generated anyway?
The Hidden Flaw: Ignoring Your Baseline Growth
The biggest problem with the simple formula is that it completely ignores your organic growth baseline. It fails to account for the customers who would have found you and the sales you would have closed without spending a single additional marketing dollar.
This oversight dangerously inflates your ROI, making lackluster campaigns look like superstars. You end up doubling down on channels that aren't truly delivering new value, a costly mistake for any business.
Let's look at a real-world scenario. Imagine a SaaS company has been growing steadily at 5% month-over-month. They launch a $10,000 ad campaign, and that month, revenue climbs from $100,000 to $125,000.
- Apparent Sales Growth: $25,000
- Apparent ROI: (($25,000 - $10,000) / $10,000) = 150%
A 150% return looks good on a report. But what was the real impact? The company's existing 5% organic growth trend means they were on track to add $5,000 in revenue ($100,000 x 5%) without any new campaigns. Your ads were only responsible for the remaining $20,000.
Calculating the Only Metric That Matters: Incremental Lift
To get a true picture, you must subtract your baseline growth. This gives you the incremental ROI—a far more honest measure of your marketing's actual contribution.
Here’s the calculation again, done right:
- Incremental Sales Growth: $25,000 (Total Growth) - $5,000 (Organic Growth) = $20,000
- True ROI: (($20,000 - $10,000) / $10,000) = 100%
The difference between a 150% and 100% ROI is massive. It’s the difference between scaling a mediocre campaign and reallocating that $10,000 to a channel that could deliver a genuine 300% or 400% incremental return.
This isn't a new theory. Decades ago, a landmark Harvard Business Review article pointed out this very flaw. The smartest marketers focus on incremental lift.
This is the exact principle we used to turn a $200K investment for a B2B client into leads valued at $6M in lifetime value. It wasn't about just blasting ads; it was about obsessively tracking the incremental impact and shifting the budget week-by-week to the channels that proved they were adding new growth—not just taking credit for it.
Measuring ROI Across Multiple Marketing Channels
Your customers don't just see one ad and immediately buy. Their journey is a winding road. They might stumble upon your brand through a Google search, get hit with a retargeting ad on Instagram, and finally convert after clicking a link in your email newsletter. This tangled path makes calculating ROI a challenge, but it's one you must solve.
A quick-and-dirty way to get a baseline is to calculate a blended ROI. This gives you a bird's-eye view of your entire marketing engine.
The formula is straightforward: Blended ROI = ([Total Revenue from All Channels] – [Total Marketing Costs]) / [Total Marketing Costs] x 100.
But here's the catch: while a blended ROI tells you if your marketing is profitable, it doesn't tell you what is working. To make smart decisions, you need to go deeper and understand how each channel contributes to that final sale. That’s where attribution modeling comes in.
This process flow shows just how misleading a surface-level view of ROI can be. It highlights how what looks like great performance can hide a much less impressive reality.
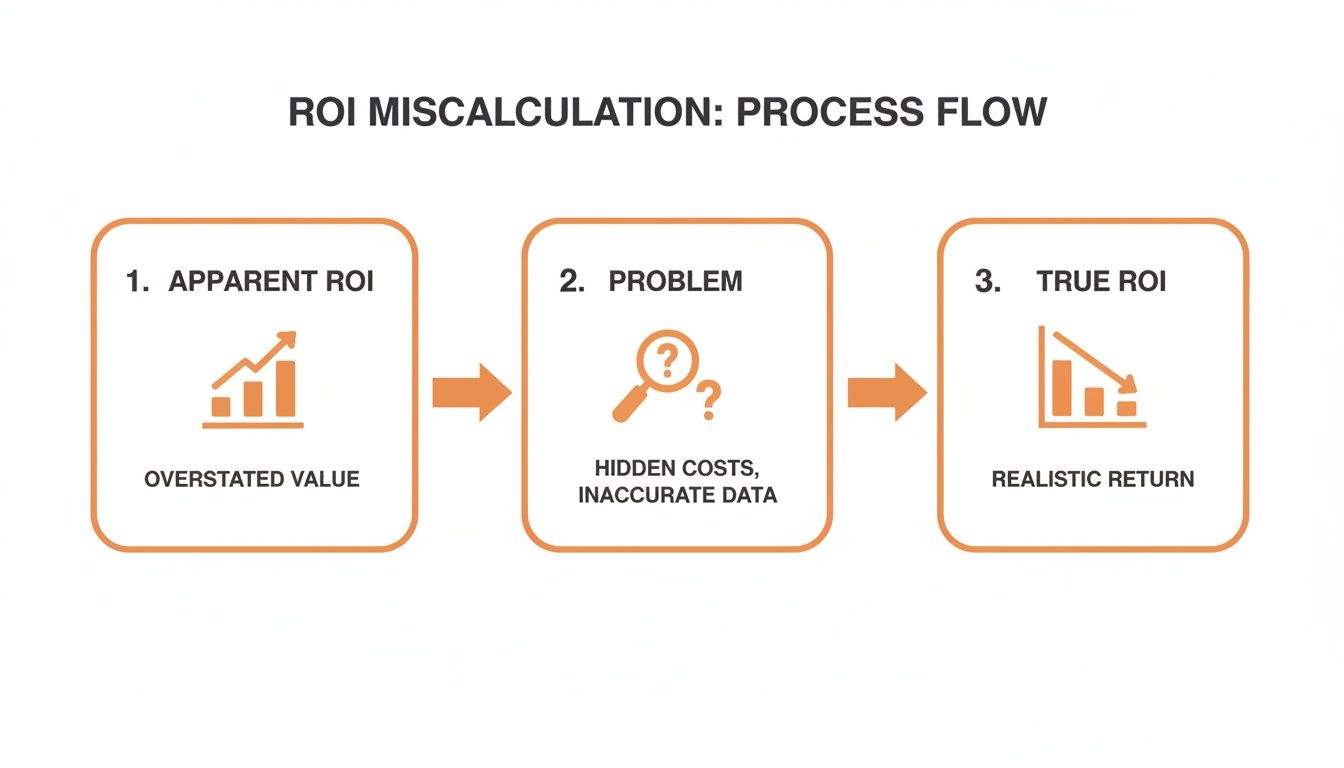
As you can see, once you factor in all the hidden costs and assign credit more accurately, the "true" ROI often looks very different from the apparent ROI.
Choosing the Right Attribution Model
Attribution models are the rules you set to give credit to marketing touchpoints. Picking the wrong one can cause you to pour money into the wrong channels.
Here are the most common models:
- First-Touch Attribution: Gives 100% of the credit to the first touchpoint. Great for seeing what sparks initial awareness, but it ignores the rest of the journey.
- Last-Touch Attribution: Gives 100% of the credit to the final touchpoint before the sale. It's the simplest to track but heavily favors bottom-of-funnel channels, making top-of-funnel efforts look worthless.
- Linear Attribution: Splits credit equally among every touchpoint. It acknowledges multiple interactions matter but falsely assumes they all had the same impact.
- Time-Decay Attribution: A more sophisticated model where touchpoints closer to conversion get more credit. This often mirrors reality, as final interactions are frequently decisive.
A one-size-fits-all approach to attribution is a recipe for misallocated budgets. The best model for you hinges on your sales cycle, business goals, and customer behavior. A B2B company with a six-month sales cycle needs a completely different model than an e-commerce brand selling $20 t-shirts.
A Practical E-commerce Example
Let’s walk through a common e-commerce journey:
- Sees a Facebook Ad (first touch)
- Reads a Blog Post found via organic search (middle touch)
- Clicks a Google Retargeting Ad (middle touch)
- Converts from an Email Promotion (last touch)
With last-touch attribution, the email campaign gets all the glory. But you're blind to the fact that the Facebook ad started the journey and the blog post built trust. A time-decay or linear model would spread the credit, showing that paid social and SEO were critical assists.
This is the kind of insight agile marketing teams use to shift budgets effectively. At Ezca, our squad model analyzes multi-touch data weekly to reallocate funds to channels that prove their value across the entire funnel—not just the ones that get the final click. To get this level of clarity, many teams invest in dedicated Marketing Attribution Software.
When you dig into multi-channel ROI, you uncover a powerful truth: properly attributed, blended campaigns can see returns jump by 300% or more. This data-driven approach is how the sharpest founders scale their businesses without relying on guesswork.
Integrating Customer Lifetime Value Into Your ROI
Looking at a campaign's ROI over the first 90 days gives you a glimpse, but it's far from the whole picture. To build a truly sustainable business, you must look past that initial transaction and focus on Customer Lifetime Value (CLV).
When you factor in CLV, your mindset shifts from chasing quick wins to building long-term, profitable relationships. You stop asking, "Did this campaign make money?" and start asking the much more powerful question: "Are we acquiring customers who will stick around and grow with us for years?"
This is the metric that separates businesses that scale successfully from those stuck in a cycle of constantly churning through their marketing budget.
Unlocking Long-Term Profitability With CLV and CAC
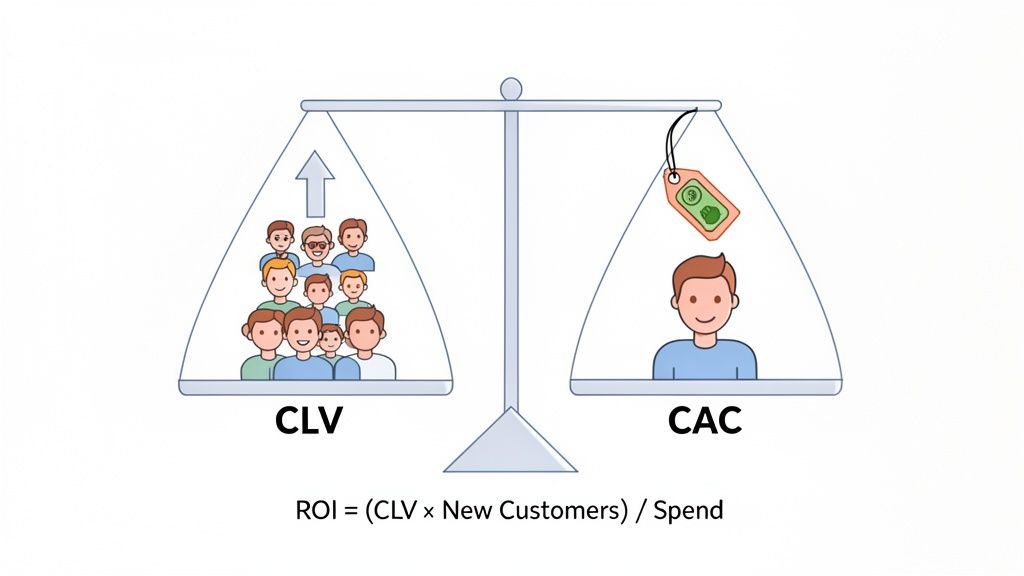
The fundamental goal of any growth-focused business is simple: spend less to acquire a customer than that customer is worth over their lifetime. This is captured by two critical metrics.
- Customer Acquisition Cost (CAC): Your total sales and marketing spend divided by the number of new customers acquired. It’s the price you pay to get one new person through the door.
- Customer Lifetime Value (CLV): The total revenue you expect from a single customer over time. A basic formula is
Average Purchase Value x Purchase Frequency x Average Customer Lifespan.
The CLV:CAC ratio is a powerful health indicator for your business. For a SaaS company, a healthy ratio is generally considered 3:1 or higher. If your CLV is $3,000 and your CAC is $1,000, you’re in a great position to scale. A 1:1 ratio is a major red flag—you’re losing money on every acquisition once you account for other operational expenses.
An Advanced ROI Formula for a Clearer Picture
Once you have a solid grasp of your CLV, you can upgrade your ROI calculation to reflect the true, long-term impact of your marketing.
The formula looks like this: Marketing ROI = (CLV x New Customers Acquired - Marketing Spend) / Marketing Spend
This simple change reframes the entire conversation around marketing performance. Instead of measuring revenue from the initial sale, you're measuring the total future value your campaign generated. It’s a game-changer for justifying investments in channels like content marketing or SEO that have longer payback periods but attract high-value customers.
A B2B SaaS Example in Action
Let’s see how this plays out. Imagine a B2B SaaS company invests $50,000 in a targeted LinkedIn Ads campaign.
- Marketing Spend: $50,000
- New Customers Acquired: 10
- Initial Revenue (First 3 Months): $60,000
Using the basic ROI formula, we get (($60,000 - $50,000) / $50,000), which equals a 20% return. It's positive, but not exciting. You might be tempted to cut the campaign.
But now, let's bring in CLV. This company knows its average enterprise customer has a CLV of $40,000.
- Total Lifetime Value Generated: 10 customers x $40,000 CLV = $400,000
- CLV-Based ROI: (($400,000 - $50,000) / $50,000) = 700%
A "modest" 20% ROI campaign is suddenly revealed as a 700% home run. This is the clarity that CLV brings. It prevents you from killing campaigns that are planting the seeds for massive future growth.
For a clearer look at this contrast, here’s a quick comparison of the two models:
ROI Calculation Models: Simple vs Advanced
This isn't a theoretical exercise. Focusing on the CLV:CAC ratio is the foundation of a sustainable growth engine. It allows you to confidently invest in channels that attract the right customers—the ones who will stay, pay, and grow with you.
This is precisely the principle we build our SaaS lifecycle email nurture programs on. The goal isn't just to convert a lead; it's to maximize their long-term value and transform a company's entire growth trajectory.
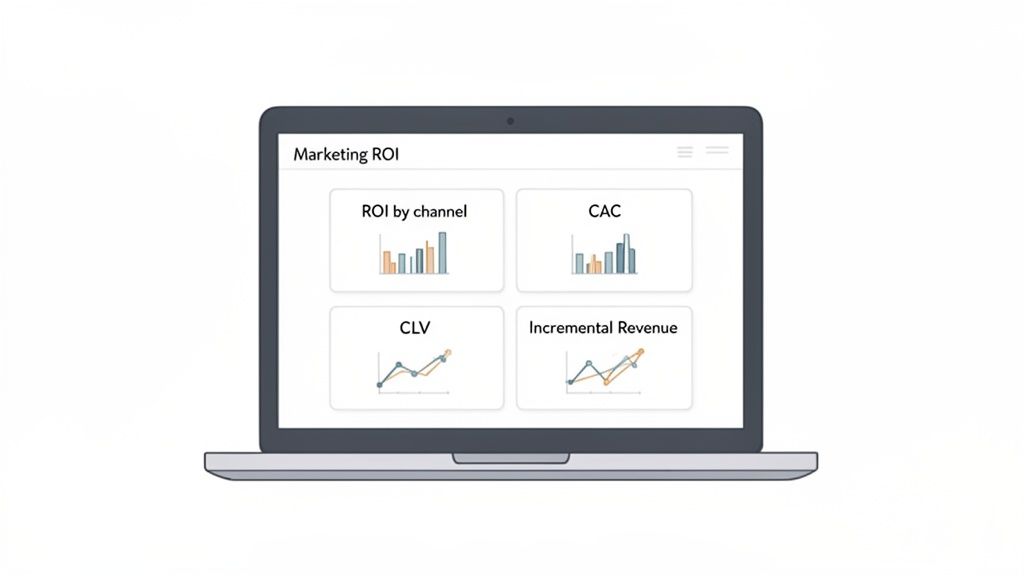
Building a Marketing ROI Reporting Dashboard
Raw data is just noise. Your ROI calculations only become valuable when they tell a clear story—one that shows your leadership team what’s working, what isn’t, and where the next big opportunity lies. A well-designed marketing ROI dashboard does just that.
Think of your dashboard as a strategic blueprint, not a data dump. It must be built for your specific business. The metrics an e-commerce brand lives by are worlds apart from what a B2B SaaS company needs to track. A one-size-fits-all dashboard creates more questions than it answers.
Core Dashboard Metrics by Business Model
To build a dashboard that gets used, zero in on the metrics that tie marketing spend directly to business results. Here’s a breakdown of the essentials by business model.
- For E-commerce Brands: Your dashboard needs to be a real-time pulse on profitability. Prioritize metrics like Return on Ad Spend (ROAS) by channel, Customer Acquisition Cost (CAC), and Average Order Value (AOV). Seeing ROAS for Google Shopping versus Facebook Ads side-by-side allows you to shift budget on the fly and maximize daily sales.
- For SaaS Companies: Here, the game shifts to long-term value. Your dashboard should highlight the CLV:CAC ratio, Monthly Recurring Revenue (MRR) from marketing-sourced leads, and lead-to-customer conversion rates. A good dashboard shows how a content campaign can still generate incredible long-term ROI by bringing in customers who stick around for years.
- For B2B Businesses: B2B means long sales cycles, so your dashboard must track the entire journey. Focus on metrics like Cost per SQL (Sales Qualified Lead), the value of the marketing-influenced pipeline, and the final ROI by channel. This proves how top-of-funnel efforts, like a webinar series, are actively feeding the sales pipeline for deals that might close months from now.
A great dashboard doesn't just show data; it answers your most pressing business questions. It shouldn't just display website traffic—it should show how that traffic turns into qualified leads and, ultimately, revenue.
Choosing the Right Tools for the Job
The tool you pick to build your dashboard should fit your company's stage and complexity. Over-engineering your reporting is just as bad as not reporting at all.
For startups and teams just starting with how to calculate marketing roi, a well-organized Google Sheet or Airtable is a perfect starting point. These tools are flexible and force discipline in what you track. You can build simple but powerful charts showing channel ROI and CAC trends.
As you grow, manual data entry becomes a bottleneck. That’s your cue to graduate to an automated platform.
- Mid-Market Businesses often get the most out of all-in-one platforms like HubSpot. These systems pull all your data into one place, giving you built-in reporting on full-funnel ROI.
- Large Enterprises and data-heavy companies need the muscle of business intelligence (BI) tools. Platforms like Tableau or Power BI can connect to dozens of data sources to create fully customized, interactive dashboards.
Whatever tool you choose, the key is consistency. At Ezca, our data-driven approach involves weekly performance check-ins, allowing our squads to dynamically shift budgets based on the latest dashboard insights. A quarterly business review (QBR) is essential for a high-level strategic overview, but the real magic happens in those frequent, agile adjustments.
Common Mistakes That Invalidate Your ROI
Even with perfect formulas and shiny dashboards, it's alarmingly easy to calculate misleading ROI figures. A single blind spot can trick you into scaling a failing campaign or killing a winner right before it pays off. Real confidence comes from knowing how to sidestep the pitfalls that invalidate your work.
One of the most common blunders is only scratching the surface of your costs. It’s easy to plug your ad spend into the formula and call it a day, but that number rarely tells the whole story. These "hidden" expenses silently chip away at your real returns.
Overlooking Your Total Marketing Investment
To get a true read on ROI, you must account for every dollar it took to get a campaign off the ground. A comprehensive cost analysis goes beyond the obvious.
Include these in your "Marketing Cost" calculation:
- Agency and Contractor Fees: The retainers or project fees you pay to partners like Ezca are a direct cost of your marketing engine.
- Software and Tool Subscriptions: Your CRM, email platform, analytics tools, and social media schedulers. These monthly fees add up.
- Creative Production: Graphic design, video editing, and copywriting for your ads and landing pages.
- Team Salaries: A portion of your marketing team’s salaries, prorated for the time they spent on a specific campaign, is a major, often-forgotten cost.
Forgetting these costs is a shortcut to an inflated ROI. A campaign that looks like a 300% return based on ad spend alone might be closer to 150% once you factor in the all-in investment.
Ignoring the Time Lag to Conversion
Another critical mistake is measuring results too soon. This is especially damaging for businesses with longer sales cycles. If you're a B2B company that typically closes deals in six months, you can't judge a campaign's ROI after 30 days.
This impatience often leads to terrible decisions, like pulling the plug on top-of-funnel content marketing or SEO because they aren't driving immediate sales. Those channels are planting seeds that you'll harvest months from now.
A core tenet of data-driven marketing is aligning your measurement window with your customer's journey. If your average sales cycle is 90 days, your primary ROI report should reflect a 90-day (or longer) timeframe.
This is exactly why our 90-day sprints at Ezca are so effective. This window gives us enough time to execute, gather meaningful data, and measure the real impact of campaigns, preventing knee-jerk reactions based on incomplete information.
Choosing the Wrong Attribution Model
We've already touched on attribution, but its importance can't be overstated. Sticking with a last-touch model when your customers have multiple touchpoints over several weeks is a surefire way to misread your data.
Consider this classic SaaS scenario:
- A prospect first finds your brand via organic search and reads a blog post.
- Weeks later, they see a LinkedIn ad and download a whitepaper.
- They then join a webinar you promoted via email.
- Finally, they type your company name into Google, click a branded ad, and request a demo.
With last-touch attribution, Google Ads gets 100% of the credit. This model incorrectly screams that your SEO, content, and email marketing are delivering zero value, tempting you to slash their budgets—a catastrophic mistake.
The fix is to pick a model that mirrors how your customers behave. For complex journeys, a time-decay or multi-touch model gives you a far more accurate view of how each channel contributes, helping you understand how to calculate marketing roi for your entire ecosystem.
Failing to Segment Your ROI Analysis
Finally, calculating one blended ROI for all your marketing is a recipe for mediocrity. A single, combined ROI of 250% might sound good, but it could be masking a huge problem.
That one number could be the average of:
- A paid search campaign crushing it at 600% ROI.
- A paid social campaign just breaking even at 0% ROI.
- An experimental channel actively losing money at -50% ROI.
Without segmenting your analysis, you’d have no idea. You would keep pouring money into underperforming channels while missing the chance to double down on your real winners. The solution is to break down your ROI by channel, by campaign, and even by audience. That detailed view is where you find the insights that truly drive growth.
Frequently Asked Questions About Marketing ROI
Once you have the formulas down, the real-world questions pop up. I've worked with countless marketing leaders and business owners, and I see the same practical challenges arise. Let's tackle a few of the most common ones.
What Is a Good Marketing ROI?
The honest answer is: it depends. A "good" ROI is tied to your industry, margins, and business model. But if you need a general North Star, many marketers aim for a 5:1 ratio, which translates to a 400% ROI.
Here’s how it often breaks down by industry:
- E-commerce and B2C: A 4:1 ratio is typically seen as very healthy.
- B2B/SaaS with Longer Sales Cycles: A 10:1 ratio or higher is the goal, especially when factoring in CLV.
- High-Margin Industries: Businesses with high profit margins can see ratios well above 10:1.
- Low-Margin Industries: For businesses selling high-volume, low-margin products, even a 2:1 ratio can be profitable and sustainable.
The only benchmark that truly matters is your own. If you hit a 3:1 ratio last quarter, your goal should be to beat it this quarter. Consistent improvement is the hallmark of a marketing program that’s working.
How Do I Measure ROI for Brand Awareness Campaigns?
It’s tricky because brand awareness campaigns aren't designed for immediate sales. Instead, you need to measure their influence using proxy metrics.
Look for indicators that your brand's presence is growing. Keep a close eye on these KPIs:
- Branded Search Volume: Are more people typing your company’s name into Google? This is a huge win.
- Direct Website Traffic: An increase in visitors who type your URL directly means your brand is becoming memorable.
- Social Media Engagement and Reach: Look for steady growth in followers, shares, and brand mentions.
- Share of Voice: How often is your brand being talked about compared to competitors? Social listening tools provide hard data on this.
The magic happens when you connect these softer metrics to financial outcomes. For instance, run a brand campaign for three months and notice that your cost-per-click on branded search ads drops by 30%. That’s a direct, tangible return.
How Long Should I Wait to Measure ROI?
Patience is a virtue in marketing. Measuring too soon can trick you into cutting off a campaign right before it delivers results. The right timeline comes down to your average sales cycle and the channel you're using.
Here are some solid rules of thumb:
- PPC and Paid Social: These channels are built for speed. You should have a clear picture of your ROI within 30 to 90 days.
- SEO and Content Marketing: This is a long-term play. Don't make a final call before 6 to 12 months. It takes that long for content to rank and pull in meaningful organic traffic.
- B2B Enterprise Campaigns: Your measurement window must match your sales cycle. If your sales team takes six months to close a typical deal, measure your marketing ROI over that same six-month period, if not longer.
Ready to stop guessing and start driving predictable growth with data-driven marketing? The experts at Ezca build and execute strategies that deliver measurable ROI. Learn how our 90-day sprints can transform your marketing performance.