Your Guide to the Break Even ROAS Calculator
Stop guessing on ad spend. Use our break even ROAS calculator and guide to find your true profitability target and drive sustainable growth for your business.
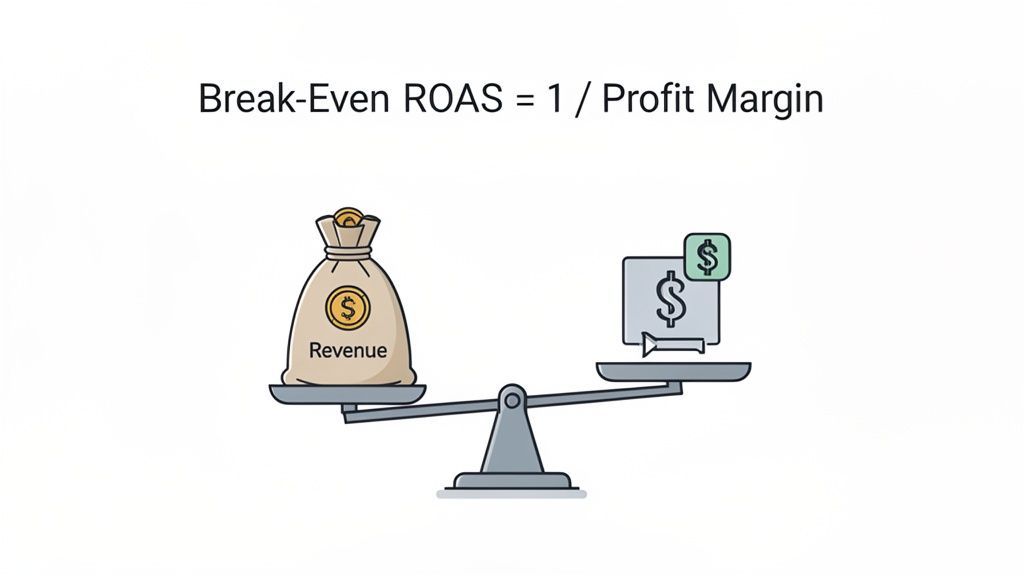
Are your ad campaigns actually profitable? It’s easy to get caught up chasing a high Return on Ad Spend (ROAS), but that metric alone is often misleading. The one number that truly matters for sustainable growth is your break-even point. The formula to find it is deceptively simple: Break-Even ROAS = 1 / Profit Margin.
Stop Guessing and Start Growing with Break-Even ROAS
I’ve seen countless marketing leaders celebrate a strong ROAS, only to discover their campaigns are still losing money. A 3x ROAS feels like a win, but if your profit margin is only 25%, you're deep in the red. This is where a break-even ROAS calculator cuts through vanity metrics and provides a clear view of profitability.
Think of it as your financial north star for paid media. It's the exact point where ad-generated revenue covers both ad spend and the cost of the goods sold. Any ROAS above this number is pure profit. Anything below is a loss.
Why This Metric Is Non-Negotiable for Leaders
For any business owner or marketing leader in e-commerce, mastering break-even ROAS is the key to scaling paid campaigns without burning through cash. Many businesses fail because they miscalculate this foundational number, leading to massive overspending on channels that appear to be performing well.
Knowing your profitability floor transforms how you manage paid media. It provides the data-backed confidence to set realistic Target ROAS bids in platforms like Google Ads or Meta, ensuring every conversion is profitable from the first click.
As a performance marketing agency, establishing break-even ROAS is a foundational metric for every client at Ezca. It's the first step in our data-driven sprints, ensuring we build campaigns on a bedrock of financial viability, not guesswork.
This simple calculation reveals the true health of your marketing efforts. Two campaigns can have the exact same ROAS but vastly different impacts on your bottom line.
Profitability at a Glance: Standard ROAS vs. Break-Even ROAS
Context is everything. Store A is losing money on a 4x ROAS because its margins are too thin. Store B, however, is solidly profitable with the exact same ad performance. This is the power of knowing your break-even point.
Turn Your Numbers Into Action
Calculating your break-even ROAS provides immediate, actionable intelligence. If your break-even point is 2.5x, you can instantly identify which campaigns, channels, or ad sets are draining resources.
This clarity empowers you to make decisive moves. You can confidently shift budget from underperforming ads to profit-driving ones or pause the losers altogether.
To get started, you can use a dedicated return on ad spend calculator to make the process quick and painless. It's all about creating a direct line of sight between ad spend and bottom-line profit—the core of a successful growth strategy.
Nailing Down Your Numbers: The Inputs You Can't Ignore
Any break-even ROAS calculation is only as good as its inputs. This isn’t just a spreadsheet exercise; it’s about gaining a crystal-clear picture of your per-order profitability. Feeding the formula bad data generates a misleading target, which is how you end up scaling ad campaigns that are secretly losing money.
Think of it as defining your profit per orderbefore factoring in ad spend. These are your unit economics, and they must be precise.
Start With Your Cost of Goods Sold (COGS)
First, define your Cost of Goods Sold (COGS). This is the direct cost of producing the product you're selling. For an e-commerce brand, this includes manufacturing, raw materials, and inbound freight charges.
Let's imagine you sell a premium skincare product for $80. Your costs might break down like this:
- $12 for the bottle, formula, and label.
- $2 for the custom-printed box.
- $1 per unit for bulk shipping to your fulfillment partner.
Your COGS is $15 per unit. This is the absolute base cost. Be precise; pull these numbers directly from your suppliers or operations team.
Don't Forget the "Other" Variable Costs
This is where many businesses go wrong. COGS is just one piece of the puzzle. You must account for every cost that fluctuates with each sale. These are the expenses that quietly erode margins if ignored.
The most common mistake I see is marketers calculating their break-even point using only COGS. This inflates your perceived profit margin, leading you to believe an unprofitable campaign is a winner.
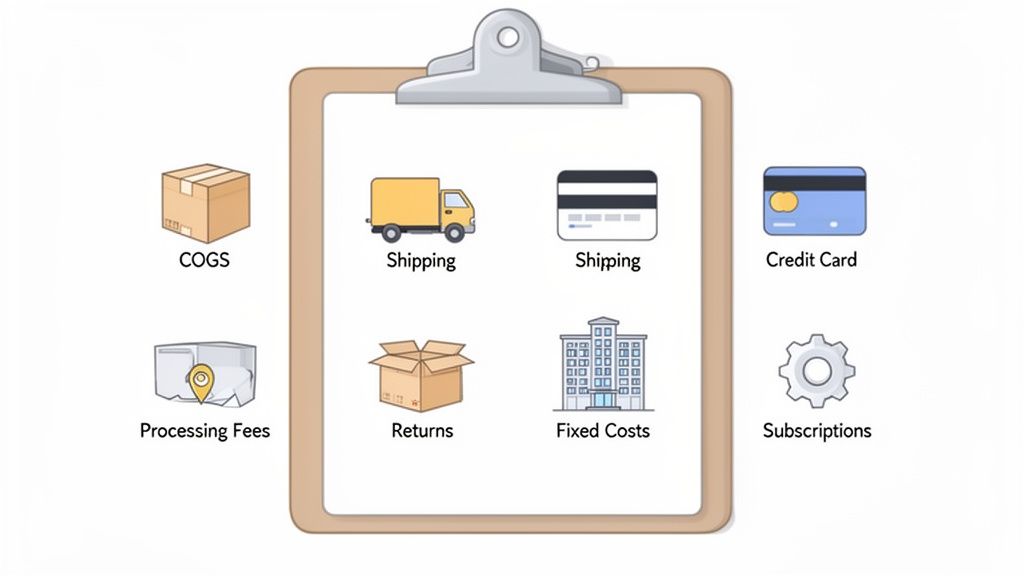
Your list of variable costs must include everything triggered by an order:
- Shipping & Fulfillment: The cost for your 3PL or warehouse staff to pick, pack, and ship an order, including labor, materials, and postage.
- Payment Processing Fees: Platforms like Shopify Payments or Stripe typically charge around 2.9% + $0.30 per transaction.
- Sales Commissions: For B2B, the sales team's commission per deal is a direct cost.
- Returns & Restocking: If 5% of orders are returned and each costs $10 to process, that adds an average cost of $0.50 to every order you fulfill.
Returning to our $80 skincare product: if average fulfillment and shipping is $8 and the payment processing fee is $2.62, your true variable cost is $25.62 ($15 COGS + $8 Shipping + $2.62 Fees).
This means your profit per sale before ad spend is $54.38. This is the number that matters. It’s the maximum amount you can spend to acquire that customer and still break even.
How to Calculate Break-Even ROAS for E-commerce
Theory is one thing; let's put these financial inputs into practice. We'll walk through a real-world e-commerce example to show you exactly how to use a break even roas calculator and find the absolute floor for your ad profitability.
Imagine you run a DTC brand selling high-quality leather goods. Your most popular item is a wallet that sells for $120, which we'll use as our Average Order Value (AOV).
Calculating Your True Profit Per Order
First, we need to nail down your actual profit on each order before considering marketing spend. Using the inputs from the previous section, let's plug in numbers for that $120 wallet.
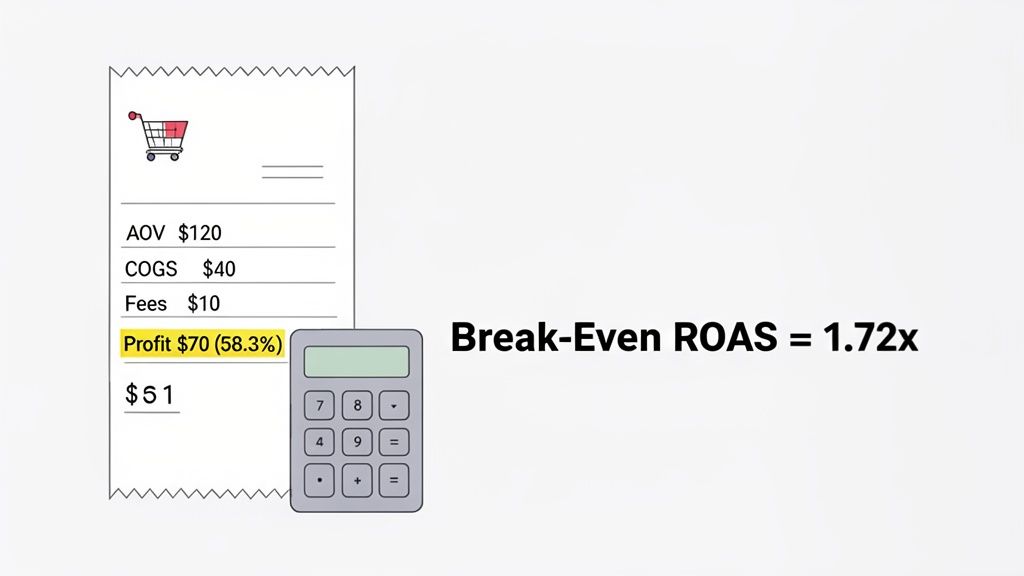
- Cost of Goods Sold (COGS):$40. This covers leather, manufacturing, and inbound freight.
- Variable Fees:$10. This bucket includes $8 for shipping and fulfillment, plus $2 for payment processing.
Your total variable cost per order is $50 ($40 COGS + $10 Fees).
Simple math shows your profit per order is $70 ($120 AOV - $50 Total Variable Costs). This $70 figure is crucial—it's the absolute maximum you can spend to acquire a customer before losing money on that first sale.
Finding Your Break-Even ROAS
Now that we know our profit per order, calculating the profit margin is simple. If you aren't familiar with the basics, it's worth reviewing how to calculate Return on Ad Spend (ROAS).
The formula is: Profit Margin = Profit Per Order / Average Order Value
For our leather goods brand: $70 / $120 = 0.583, or 58.3%
Now for the main event. We plug that margin into the break-even formula: Break-Even ROAS = 1 / Profit Margin
Let's do the math: 1 / 0.583 = 1.72
Your break-even ROAS is 1.72x.
This number is your line in the sand. For every $1 you invest in advertising, you need at least $1.72 in revenue to cover product costs and that ad dollar. Any ROAS above 1.72x is profit. Anything below is a loss.
Interpreting and Acting on Your 1.72x ROAS
Knowing this number changes how you view campaign performance. A 2.5x ROAS isn't just "good"—it's generating measurable profit. A 1.5x ROAS, no matter the conversion volume, is actively burning cash.
This calculation empowers you to set intelligent Target ROAS bids in Google Ads and Meta, ensuring you never overpay for a customer on their first purchase. For a closer look at scaling your store, check out our approach to e-commerce growth.
It also serves as a clear benchmark for channel performance. If Google Ads is cruising at 3.0x while Facebook Ads sputters at 1.6x, you have the data to confidently shift budget to the profitable channel. This is the core of the dynamic budget allocation we implement at Ezca—ensuring our clients' ad spend always chases the highest profitable return. Using a break even roas calculator brings that same discipline to your own marketing.
Adapting the ROAS Formula for SaaS and B2B
Calculating break-even ROAS for a subscription or lead-gen business is a different ballgame. Unlike e-commerce, value isn't captured in a single transaction. The true value of a SaaS or B2B customer unfolds over months or even years.
Focusing only on the first transaction is a classic mistake that leads marketers to kill their most profitable long-term campaigns.
The key is to shift from single-purchase profit to long-term value. This requires mastering two critical metrics: Customer Acquisition Cost (CAC) and Customer Lifetime Value (LTV). They are the foundation of a smart break even roas calculator for any recurring revenue model.
The SaaS LTV-to-CAC Approach
For a SaaS business, the first monthly payment is just the beginning. The real story is the total revenue a customer generates over their entire lifecycle. This is why LTV must be the heart of your break-even math.
Consider this real-world SaaS scenario:
- Subscription Plan:$150 per month
- Average Customer Lifespan:24 months
- Gross Margin:30% (after server costs, support, etc.)
First, calculate total lifetime revenue: $150/month x 24 months = $3,600.
Next, find the lifetime profit: $3,600 x 30% Gross Margin = $1,080.
That $1,080 is your North Star. It's your LTV-based profit, representing the absolute maximum you can spend to acquire that customer and still break even long-term. Any CAC below that threshold means you've acquired a profitable customer.
This completely reframes bidding strategy. An initial ROAS might look terrible, but if the LTV justifies a high upfront CAC, you're winning. You aren’t just buying one transaction; you’re investing in a future revenue stream.
This is why our teams at Ezca operate in 90-day sprints. We constantly track lead quality and project LTV, giving us the confidence to run campaigns that might lose money on day one but deliver huge returns by month six. Dive deeper into our approach in this guide to SaaS marketing that drives growth.
Working Backwards for B2B Lead Generation
For B2B marketers, the funnel is even more complex. You're generating leads for a sales team to close. In this case, your break even roas calculator must work backward from sales outcomes and your target CAC.
A high Cost Per Lead (CPL) on a platform like LinkedIn can be intimidating, but it's often justified by the high value of a closed deal. While data suggests B2B campaigns on LinkedIn average a 3.5x ROAS, many startups burn cash without this data-driven clarity. You can find more info on this at PMcalculators.com's break-even point guide.
Let's map this out for a B2B company using LinkedIn ads:
- Target CAC:$2,000 (The maximum you're willing to spend to land a new client)
- Lead-to-Close Rate:10% (Sales closes 1 of every 10 qualified leads)
With these two figures, you can pinpoint your maximum allowable CPL: $2,000 Target CAC x 10% Close Rate = $200 per lead.
This number is gold. It tells your marketing team they can spend up to $200 for a qualified lead and still hit profit goals. A campaign with a $180 CPL now looks great, while one at $250 signals an urgent need for optimization. This clarity lets you invest confidently in channels that bring expensive but high-quality leads, because you know the math works.
Putting Your Break-Even ROAS into Action
Figuring out your break-even ROAS is a great first step, but that number is useless sitting in a spreadsheet. The real value comes from using it to make smart decisions daily.
Think of it as your profitability floor. It’s not just another metric; it's a guardrail that transforms ad spend from a gamble into a calculated investment. It’s how you stop hoping for profit and start engineering it.
Set Your Bidding Floor
The most direct application is within your automated bidding strategies. Using Target ROAS (tROAS) on Google Ads or Meta without a clear floor is flying blind. You might get conversions, but you won't know if you're making money.
Let’s say your break even roas calculator shows your floor is 1.72x. Setting your target at 1.72x only gets you to zero. You must build in a profit margin. A good rule of thumb is to set your tROAS 20-30% higher than your break-even point.
For a 1.72x break-even, you’d start with a target between 2.1x and 2.2x.
This simple move is powerful. It tells the platform’s algorithm to stop chasing cheap clicks and focus your money only on users likely to meet your profitability goals.
This becomes critical when scaling. As you increase budget, the platform naturally seeks a broader audience, often leading to lower ROAS. By anchoring your bidding to a profitable target, you maintain financial discipline as you grow.
For a SaaS business, the relationship between ad spend and long-term profit is a journey, not a single event.
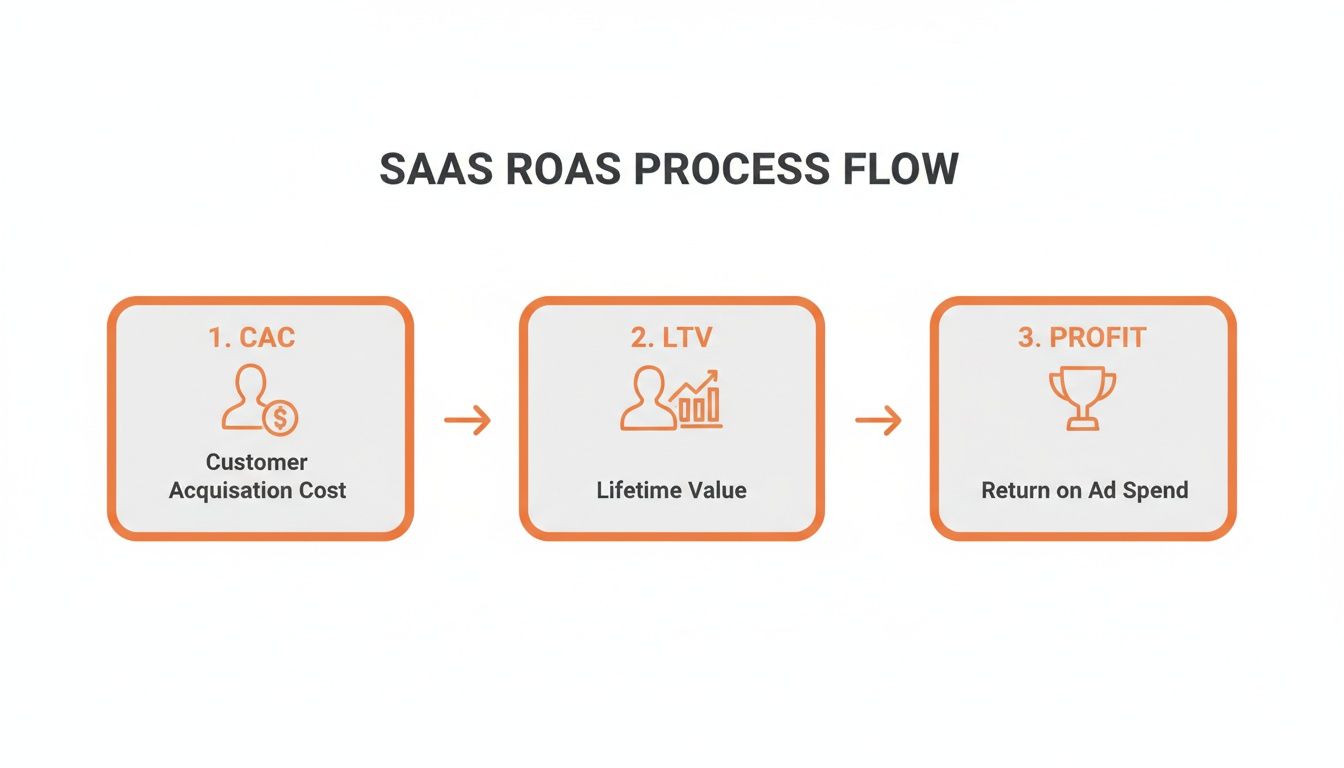
As you can see, the customer acquisition cost (CAC) is just the beginning. Sustainable profitability comes from maximizing customer LTV, which is what allows you to achieve a healthy ROAS over time.
Evaluate Channel and Campaign Performance
Your break-even ROAS is the ultimate truth-teller for your marketing mix. It cuts through misleading vanity metrics. A 4.0x ROAS on one channel might look incredible next to a 3.0x on another, but if the first channel sells low-margin products, you could actually be losing money.
I recommend building a simple dashboard that compares each channel’s actual ROAS against your break-even number.
- Google Ads: Actual ROAS 3.5x vs. Break-Even 2.0x (Profitable)
- Facebook Ads: Actual ROAS 2.1x vs. Break-Even 2.0x (Breaking Even)
- TikTok Ads: Actual ROAS 1.8x vs. Break-Even 2.0x (Losing Money)
Suddenly, your path is clear. Invest more in Google, optimize Facebook, and either fix TikTok or cut your losses. This is the exact data-driven approach we use to manage client accounts, reallocating budgets to channels that consistently crush their break-even targets. To see more about how we do it, check out our paid search management services.
Improve Your Actual ROAS
What if your campaigns consistently fall short of your break-even target? Don't panic. You have two main levers to pull: fix your marketing or fix your math.
Campaign-Side Fixes (Improving Conversion):
- Refine Ad Creative: Test new headlines and images that speak directly to customer pain points and high-value benefits.
- Optimize Landing Pages: Improve page speed, clarify your call-to-action, and add trust signals like reviews. A 1% bump in conversion rate can dramatically improve ROAS.
- Sharpen Your Targeting: Get ruthless. Exclude demographics, locations, or audiences that aren't profitable.
Business-Side Fixes (Improving Unit Economics):
- Increase Average Order Value (AOV): This is often the fastest way to boost ROAS. Introduce product bundles, offer a free shipping threshold, or implement post-purchase upsells.
- Improve Margins: Negotiate better rates with suppliers. Find cheaper shipping options. Lowering your COGS directly reduces your break-even ROAS, giving your campaigns more room to be profitable.
Putting Your Break-Even ROAS to Work: Common Questions
Calculating your break-even ROAS is a huge first step. But once you have that number, the real work begins. Marketing leaders and founders I talk to always have practical questions about what to do next. Let's walk through the most common ones.
What Should I Do If My ROAS Is Below My Break-Even Point?
Seeing a ROAS figure lower than your break-even point is a clear signal: your ad campaigns are currently losing money. This is a powerful call to action.
Before touching a single campaign, double-check every input in your calculation. A simple mistake in COGS or payment fees can throw everything off. If your numbers are solid, it's time to investigate two key areas.
- Dig into Campaign Performance: Get inside your ad accounts. Are you overbidding on non-converting keywords? Is your audience targeting too vague? A/B test ad creative, scrutinize landing page conversion bottlenecks, and get ruthless about what's working and what's not.
- Sharpen Your Unit Economics: Step back from the ads and look at your core business numbers. Can you bundle products to boost Average Order Value (AOV)? Can you renegotiate supplier rates or find a more efficient shipping partner? Sometimes the biggest wins come from the business side, not marketing.
At Ezca, this is exactly where we start our 90-day sprints. We methodically test variables across both the campaigns and the business itself to find the root cause and build a clear plan to drive ROAS well into profitable territory.
How Often Should I Recalculate My Break-Even ROAS?
Your break-even ROAS isn't a static number. It’s a living metric that changes as your business evolves. You must recalculate it anytime a core financial component shifts.
This means running the numbers again whenever you see changes in:
- Product costs from suppliers (COGS)
- Shipping and fulfillment rates
- Transaction fees from your payment processor
- Your pricing, including promotional discounts
As a rule of thumb, a full review once per quarter is a solid baseline. But if you’re in a fast-moving industry or run frequent promotions, a monthly check-in is much smarter. Keeping your break-even ROAS up-to-date ensures your bidding targets are always grounded in financial reality.
Is a Higher Break-Even ROAS a Good Thing?
It’s easy to get this one backward, but a higher break-even ROAS is a sign of a problem—it means your profit margins are razor-thin.
Think about it this way:
- A business with a 5x break-even ROAS needs to earn $5 in revenue for every $1 spent on ads just to cover its costs.
- A business with a 2x break-even ROAS only needs to bring in $2.
The business with the lower break-even point has a much healthier margin and a wider path to profitability. If your break-even ROAS is high (anything over 4x is a red flag), your top priority shouldn't be tweaking ad campaigns. It should be improving your fundamental unit economics.
Your goal is always to lower your break-even ROAS, making it easier for every advertising dollar to turn a profit.
Ready to stop guessing and start building a truly profitable marketing engine? The team at Ezca uses these same data-driven principles to help brands achieve measurable growth. We combine expert strategy with AI to optimize every dollar you spend. Schedule a consultation with us today.